Selling Skill
If you invest in individual stocks, I would bet that at any given moment, you have a pretty good idea of how your portfolio is doing for the year, both in absolute terms and relative to the overall market. But I’d be just as willing to bet you have no idea about the aggregate performance of stocks you’ve recently sold. Every retail brokerage service I’ve seen allows you to easily track the performance of securities you have purchased. Not a single one that I'm aware of allows you to easily track the subsequent performance of securities you have sold. This feature is probably absent for a couple of reasons. One, brokerages may prefer that their clients don’t have this information, as a decent fraction of them would quickly discover their sells had outperformed their buys, and be discouraged from trading as frequently (or at all) in the future. But I suspect the main reason is more fundamental: nobody wants to think about the stocks they’ve sold in the first place. If it turns out that a stock you sold indeed went on to underperform, then great, you will feel good about it. But if it went on to outperform, it’s going to make you feel disproportionately worse. Not only did you give up some gains, but you paid a commission, may have paid capital gains taxes, and likely put some time and stress into the decision as well, and for all that you would have been better off playing Candy Crush instead. This asymmetry in attention is not limited to individual investors: a paper published earlier this year and summarized in an Institutional Investor article finds that professional portfolio managers have real skill at choosing the right stocks to purchase but would be better off selling at random. It may be even worse for retail investors: supposedly an internal study at Fidelity found that their best-performing accounts belonged to investors who either forgot their accounts existed, or in more extreme cases, had in fact died, leaving their portfolios as unusually pure instances of a buy-and-hold-forever strategy. For my own contribution to the public body of knowledge on this topic, I’ve delved into a proprietary data set never before analyzed: my personal trading history. Specifically, all transactions involving long positions in common stocks or ETFs across two brokerage accounts (one taxable, one an IRA) for the last four years. I’ve excluded trades in short positions and options because they are weird and different and tiny in terms of both number and dollar value (10 transactions for a grand total net profit of $7.47 in this period). Full disclosure: the event that motivated me to go through this exercise in the first place is a trade I recently made and immediately regretted. I sold part of my stake in Shopify when it dipped briefly due to an analyst downgrade, and not only did I sell at exactly the bottom of this quick dip, I now owe a good chunk of capital gains taxes for the privilege of doing so. Yeah, you caught me in a humblebrag: I may be dumb for selling Shopify at a bad time, but I'm also smart for owning one of the best-performing stocks of the last few years in the first place. Whichever is the case, I wanted to determine with data whether I’m actually bad at selling stocks, or if this was simply an outlier. The main metric I’m going to look at to find out is price performance of my sold securities versus that of the S&P 5001. First, how is my timing? Here’s how my sells moved relative to the S&P after one week: 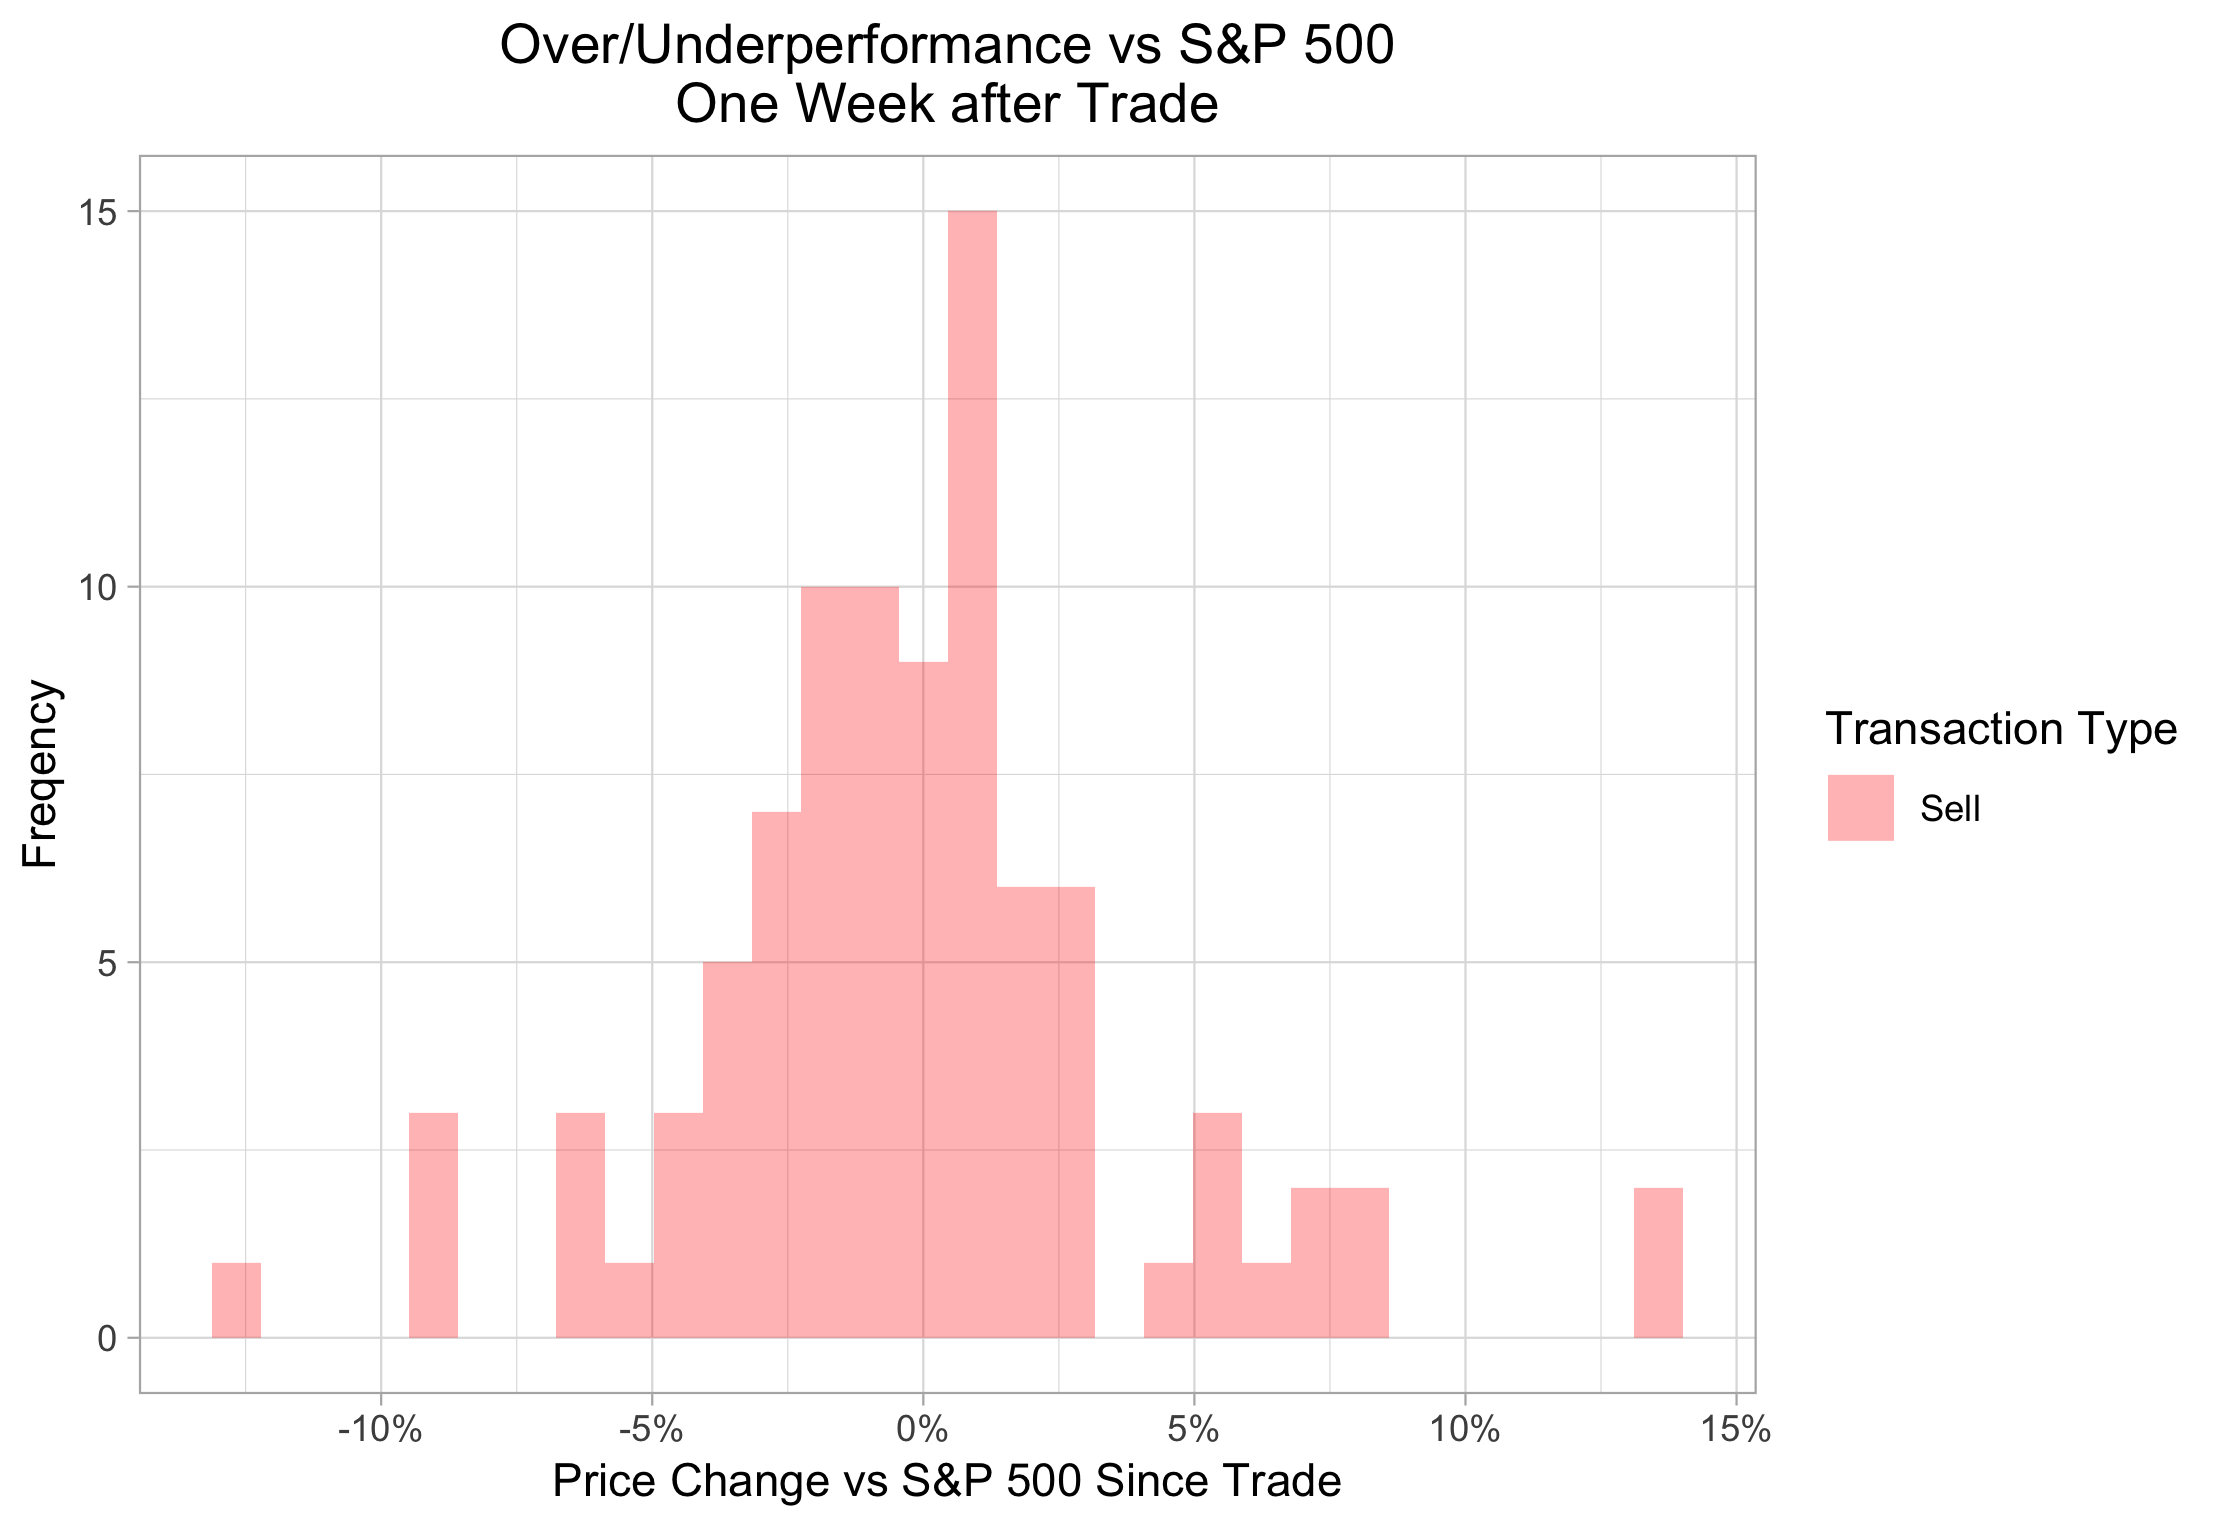 With a mean outperformance of 0.1371%, my sold securities ever so slightly outperformed the market on average. However, only 44 of 90 sold securities outperformed the S&P over the next week, and the distribution looks roughly symmetrical, so it seems more likely that this slight outperformance is due to random chance than anything else2. OK great, so I’m not actively terrible at week-to-week timing when it comes to selling stocks. But were these sells good decisions to begin with? Since I typically intend to hold (and not hold) stocks for periods of at least a year, let’s look at price changes over a longer time frame to answer that question:
 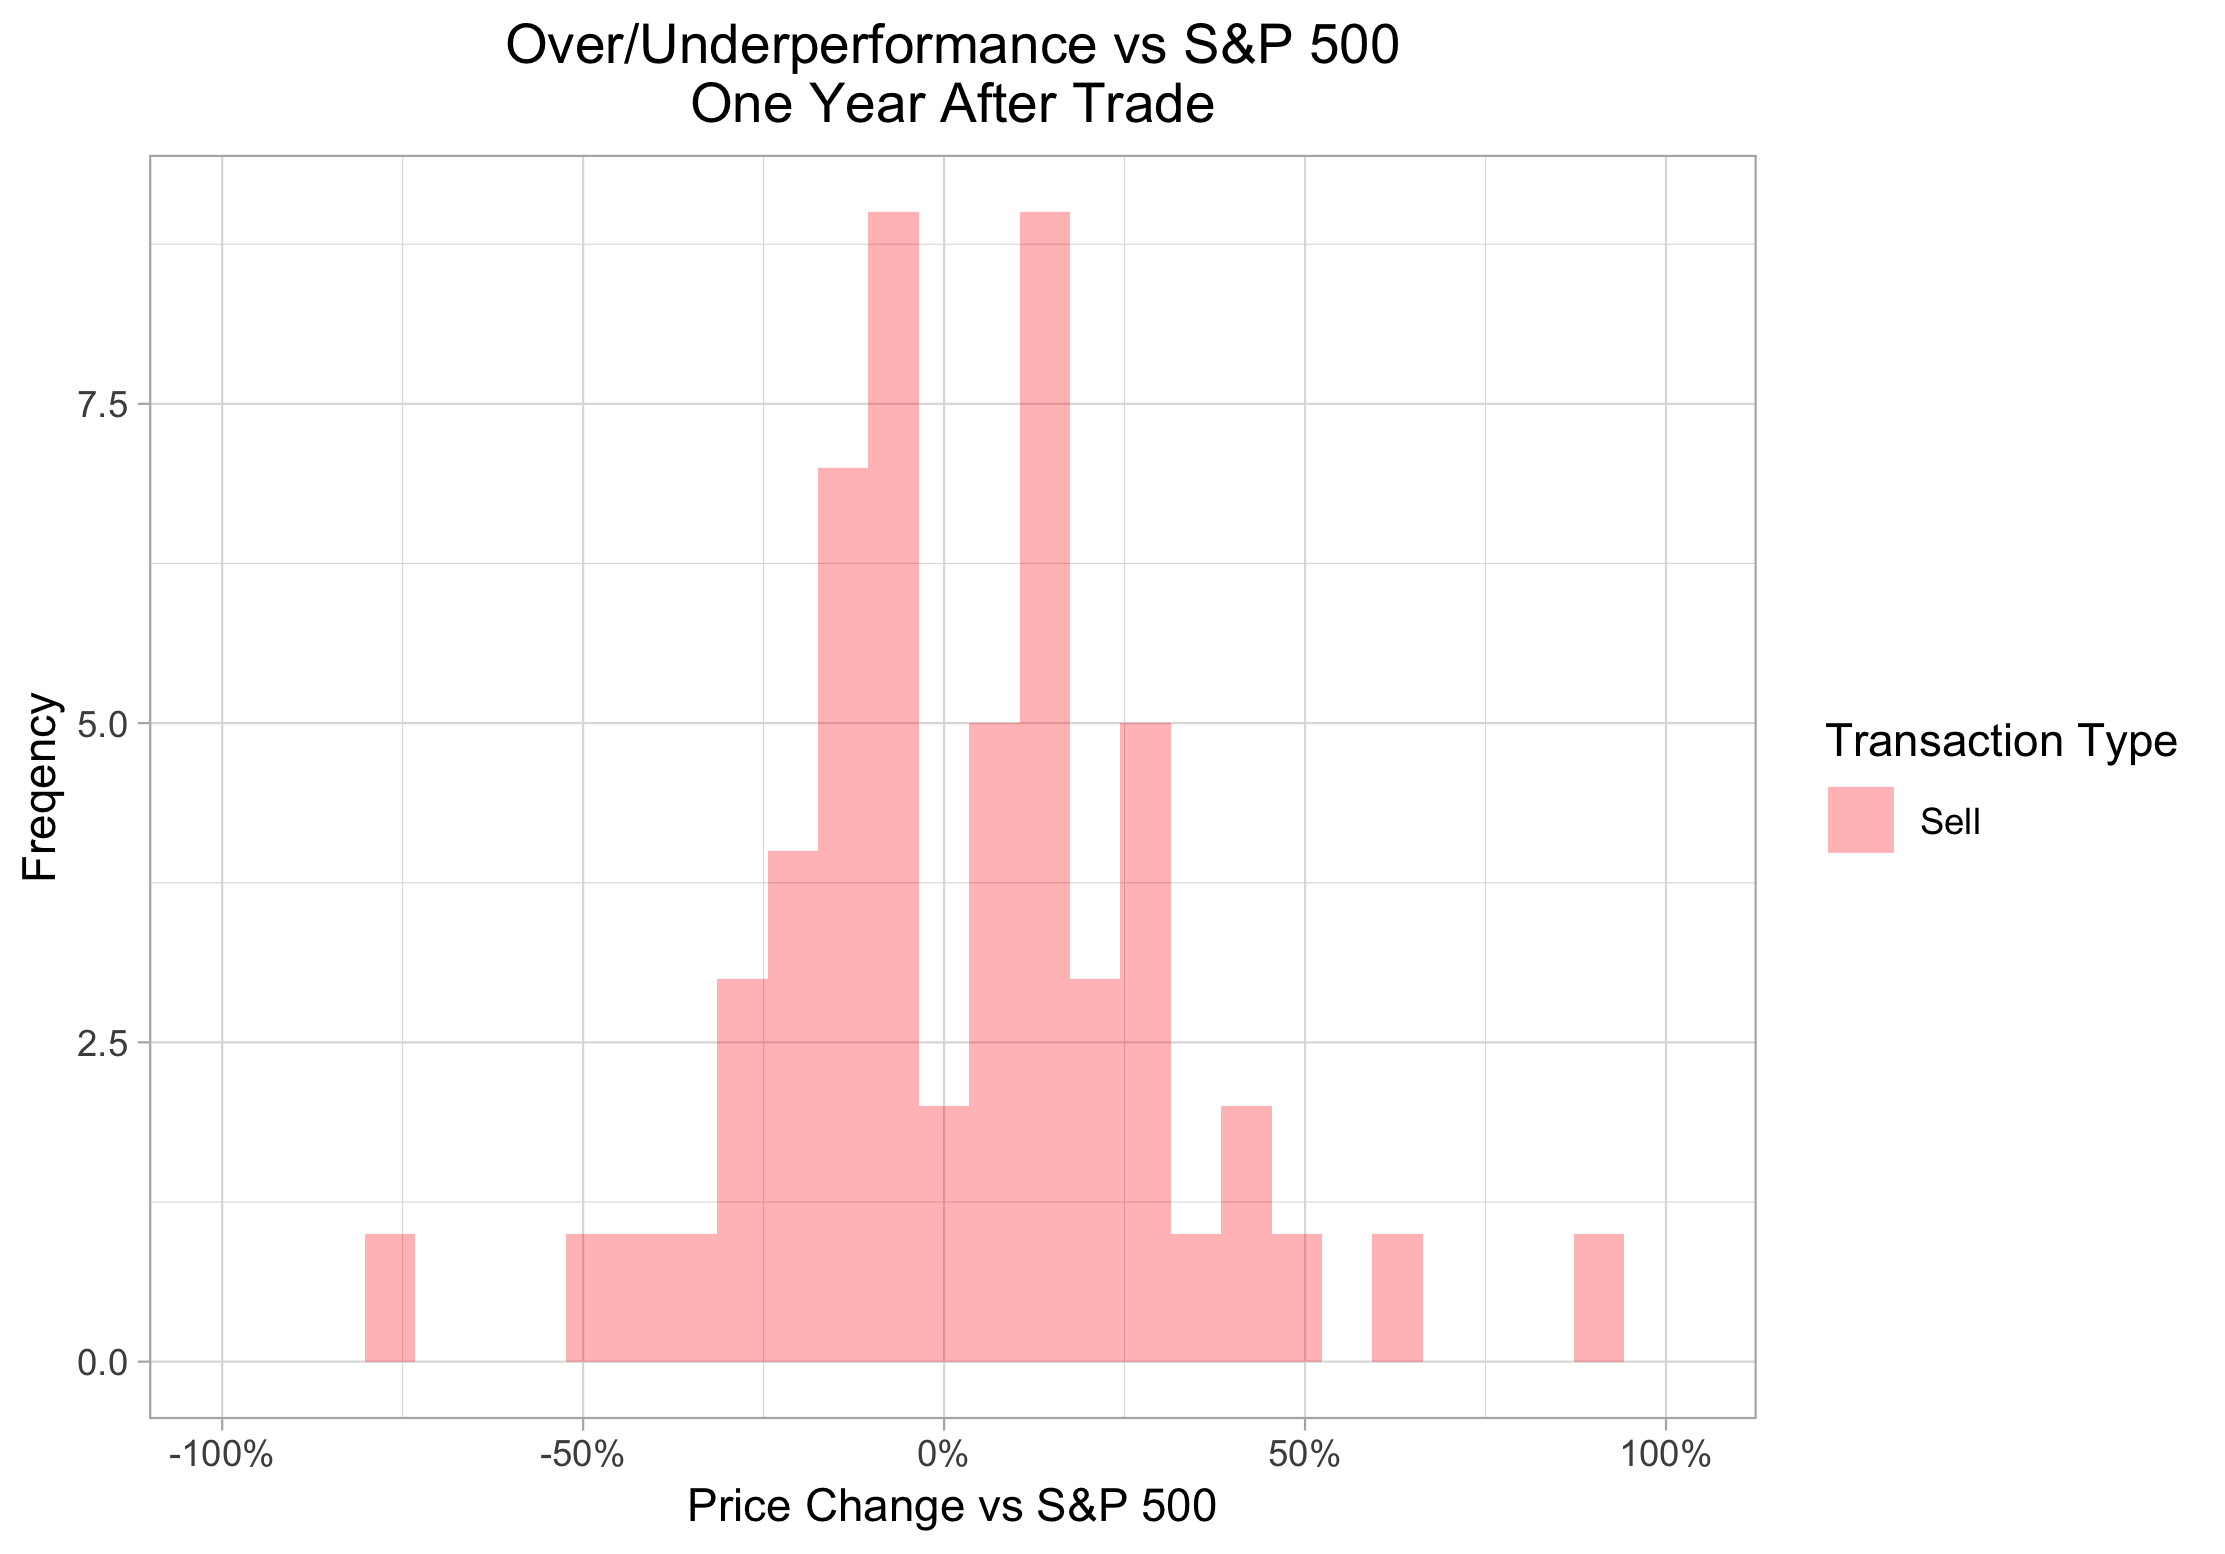 Still pretty symmetrical and on this time frame exactly 50% of the sold stocks went on to outperform while the other 50% underperformed. How about the total price change since the trade, regardless of the trade date?
 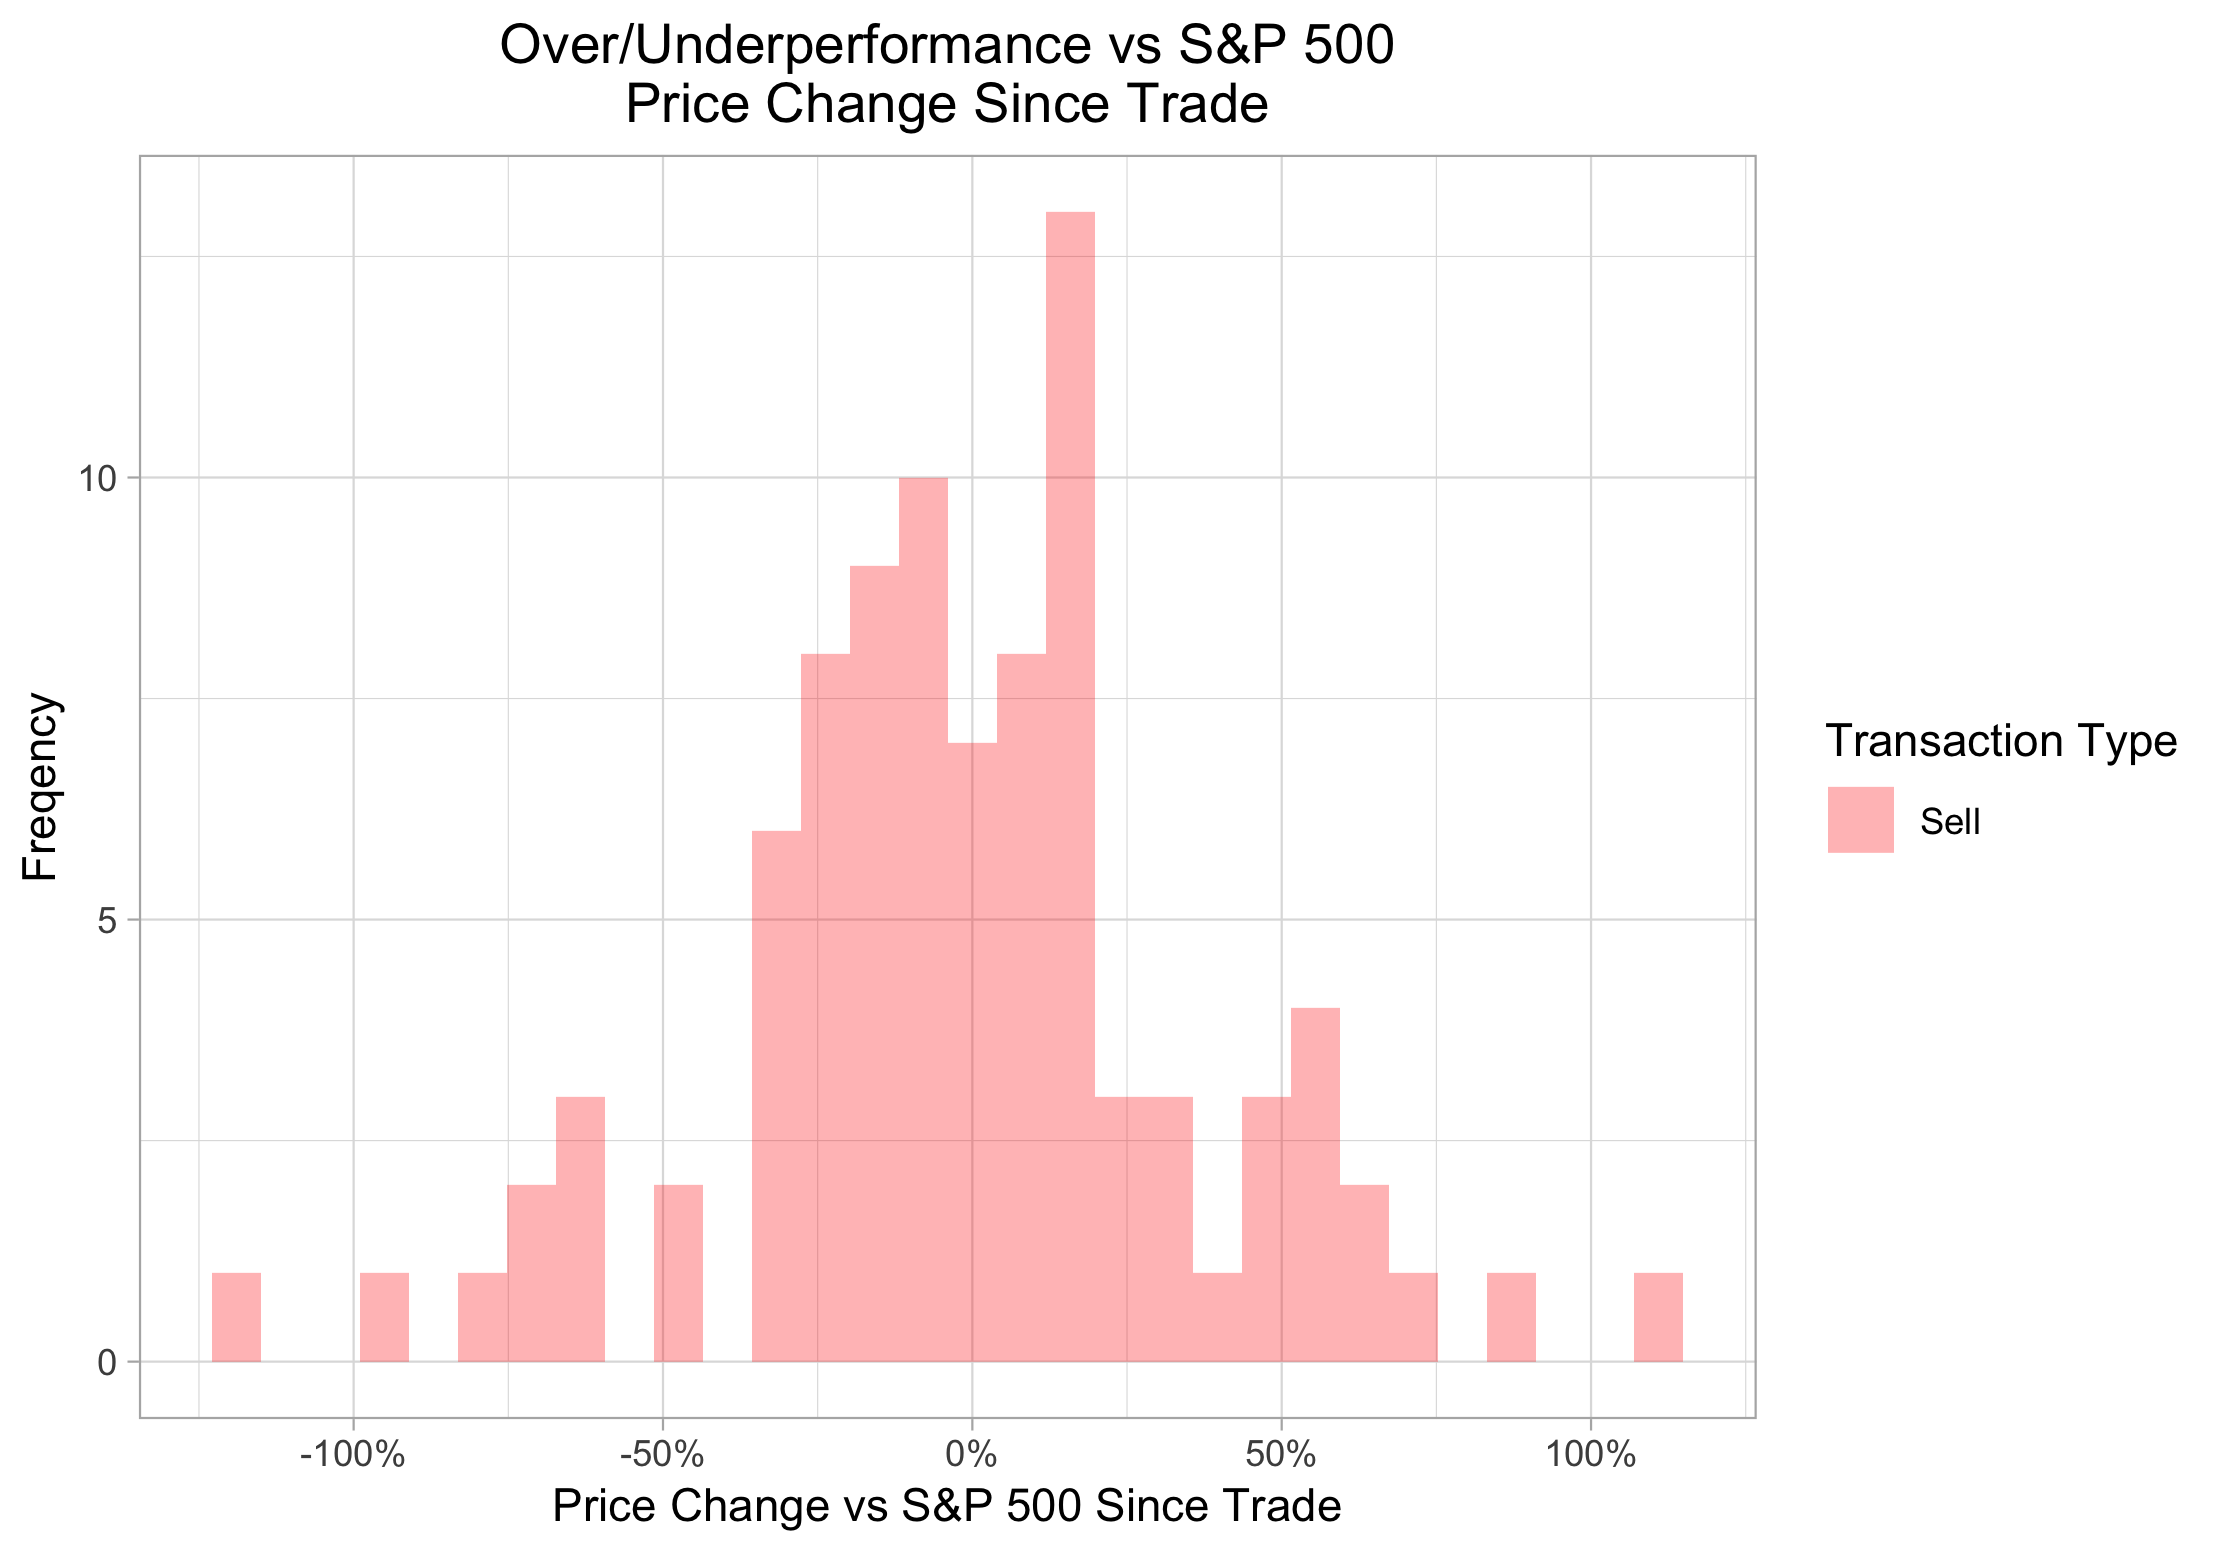 This still looks pretty much like noise, and I’ll take it! Based purely on emotional memory, I would have expected far worse. That is to say, I remember those stocks which performed well after I sold much better than those which declined after I cut them loose. This is, now that I think about it, probably not a coincidence: I am very aware that Tencent went on to do well after I sold it because it’s a massive and important company which has gone on to become roughly 30% more massive and important after it exited my portfolio. I was not at all aware until running these numbers that Fossil has slid almost to penny-stock status because, apparently like people who buy watches, I had forgotten about the company entirely. Ok, great, so I appear to be something like average, or at least not terrible, at selling. But the real question is one of opportunity cost: since I’m typically selling stocks to free up cash for buying other stocks, it’s not really important whether my sells outperform the market, but whether they outperform my buys. In other words, I can afford to be average at selling if I’m good at buying, or even actively bad at selling if I’m really good at buying3. Here’s where I start to feel pretty good:
 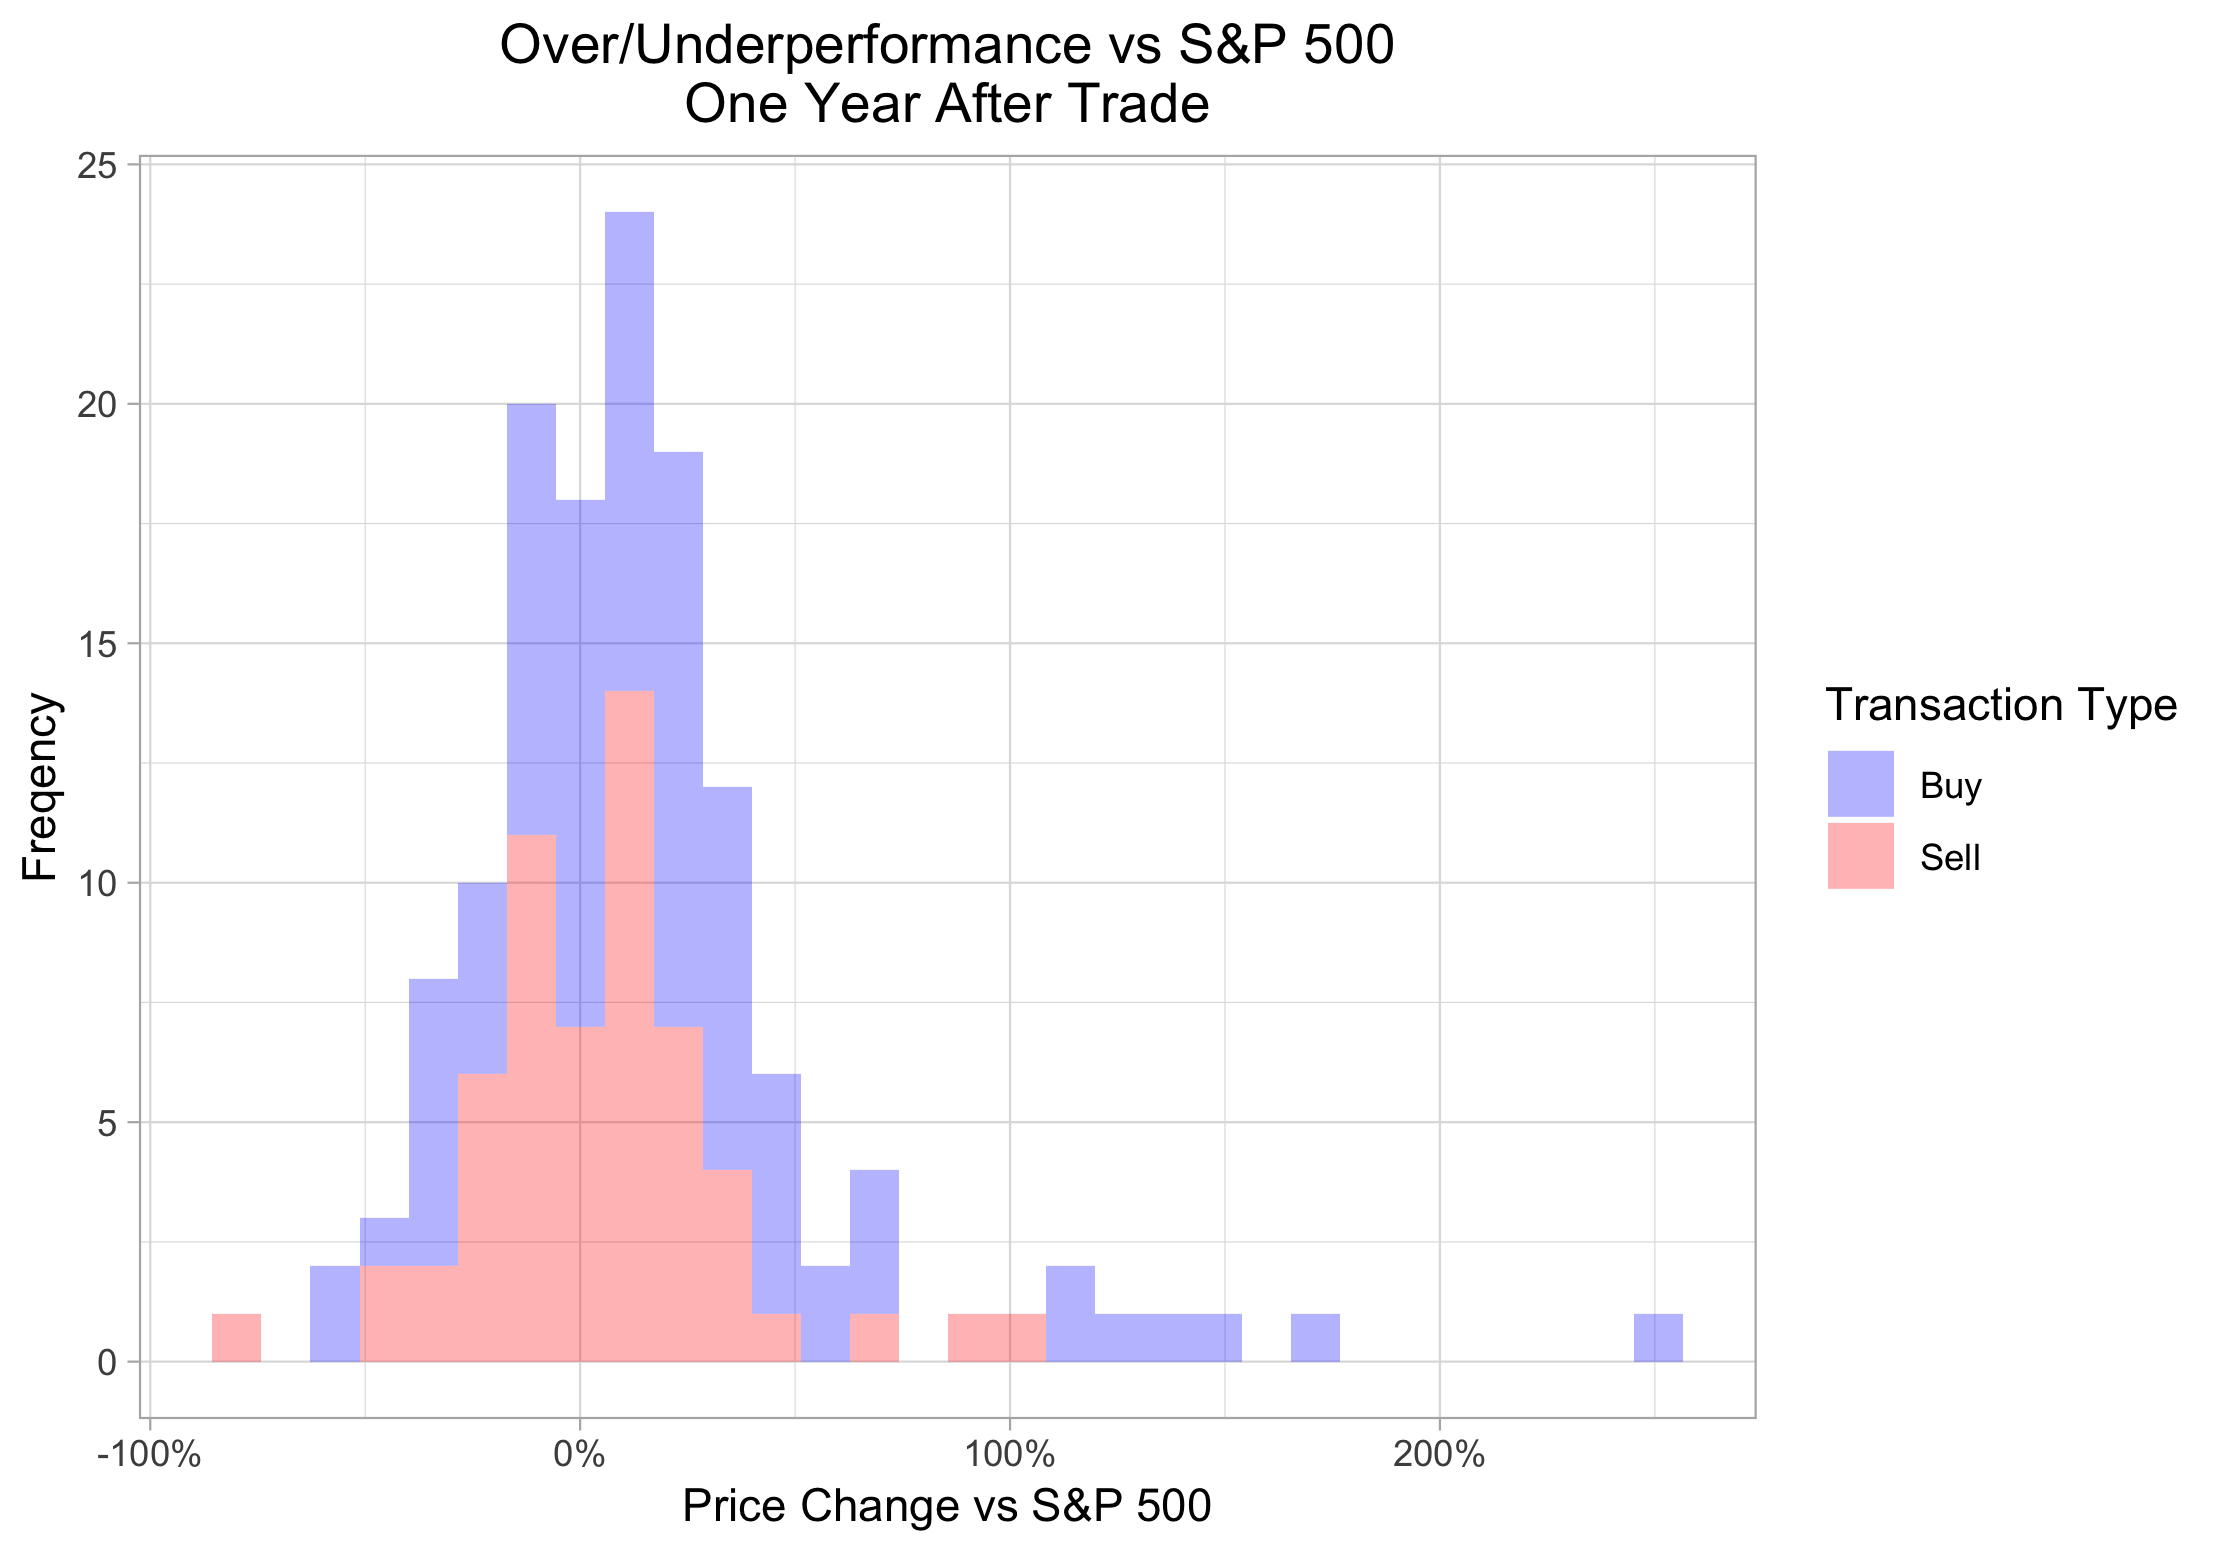 The buys are not only outperforming frequently (54 of 80 in this period), the outperformers are having a bigger impact than the underperformers, as the distribution is right-skewed. And it things look even better if I extend the time frame:
 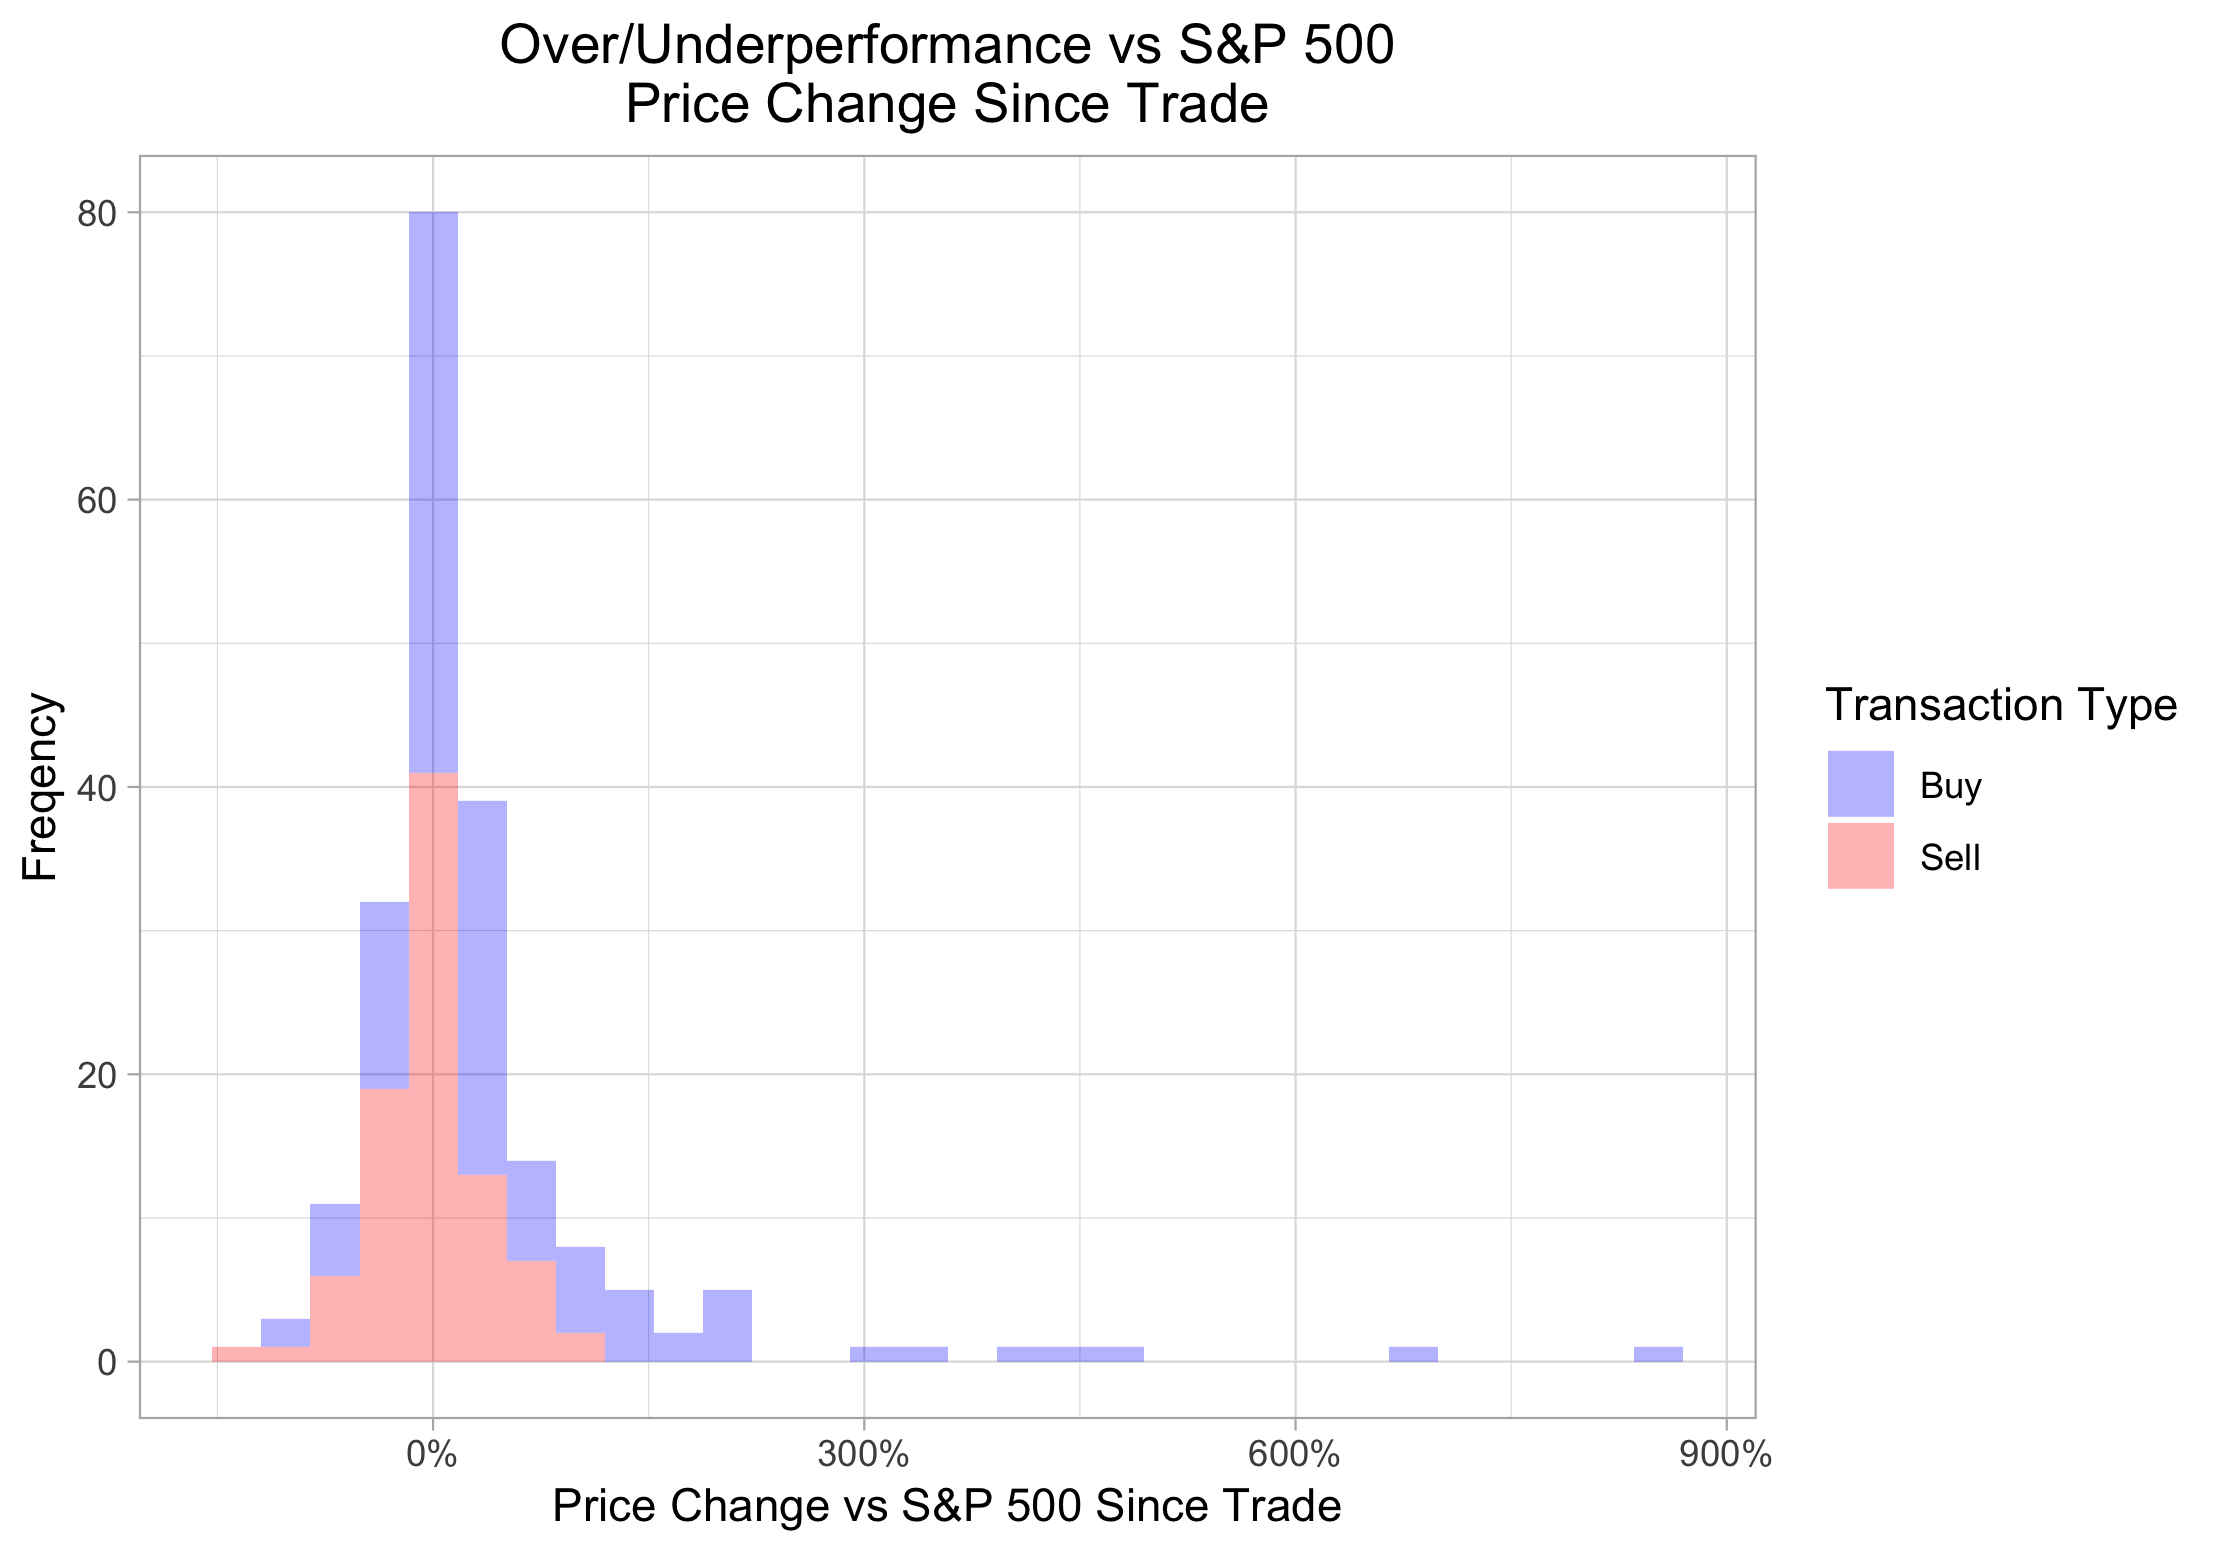 It now looks like we have two totally different distributions, and fortunately, the one with a few really points far on the right is the "buys". I've definitely sold some winners, but, at least in this time range, managed to avoid prematurely selling any of the truly massive winners. In case you are curious, the big winners among the buys (>300% outperformance) are, in descending order, Shopify (twice), Mercadolibre, Twilio, Okta, Simulations Plus, and Zendesk. I’m not going to list the sells, because hey, who wants to think about stocks they've sold?
Footnotes
1. I’m ignoring dividends in this analysis; over relatively short time periods, price changes are the dominant component of total return, and I’m only interested in the aggregate performance of my sells vs. the market, not those of individual securities, so while some of the stocks in question yield less than the S&P, some yield more, and in aggregate they will come pretty close to balancing out. 2. I'm not going to run a statistical test for the mean of this data, because I'd have to assume a distribution, and while this might look a normal distribution, it isn't: like most asset price data it has fat tails. But a binomial distribution statistical test on the binary outcome of outperform/underperform for each trade shows we would see a result at least this extreme pretty much all the time (p = 0.9161) if the underlying probability of outperforming was a coinflip. 3. Additionally, it’s possible that my sold securities go on to outperform the S&P 500 only because they are higher quality in the first place. In the extreme case, if I only hold securities that are going to outperform over the next year, then no matter what I sell, it’s going to look bad, but selling could still be a good decision if I then buy something else which goes on to outperform.