Momentum is Real, but it's Complicated
When I started following the stock market roughly 10 years ago, I was under the impression that technical analysis was complete nonsense, and what stock prices did tomorrow had nothing to do with what they did yesterday. This seemed to be the consensus among the no-nonsense, value-oriented investors whose books and blogs I read. Not until I read "The (Mis)behavior of Markets" by Benoit Mandelbrot a few years later did I seriously consider the idea that past stock price movements might actually have an influence on future price movements. Still, lots of respected investors and academics seemed to think that stock price movements were a random walk, and the technical analysis I read about just sounded like bunk, with weird-sounding terms like "Death Cross" and "Head and Shoulders Pattern". This crap couldn't be real, could it? When you see contradictory opinions from different smart people about an issue, the only thing left to do is look at the data yourself. So let's look at the data, starting with daily S&P 500 adjusted closing prices since 1950 from Yahoo Finance. Here's a boxplot showing the distribution of daily price changes for the S&P 500 for each day since 1950, segmented by the direction of the previous day's move. 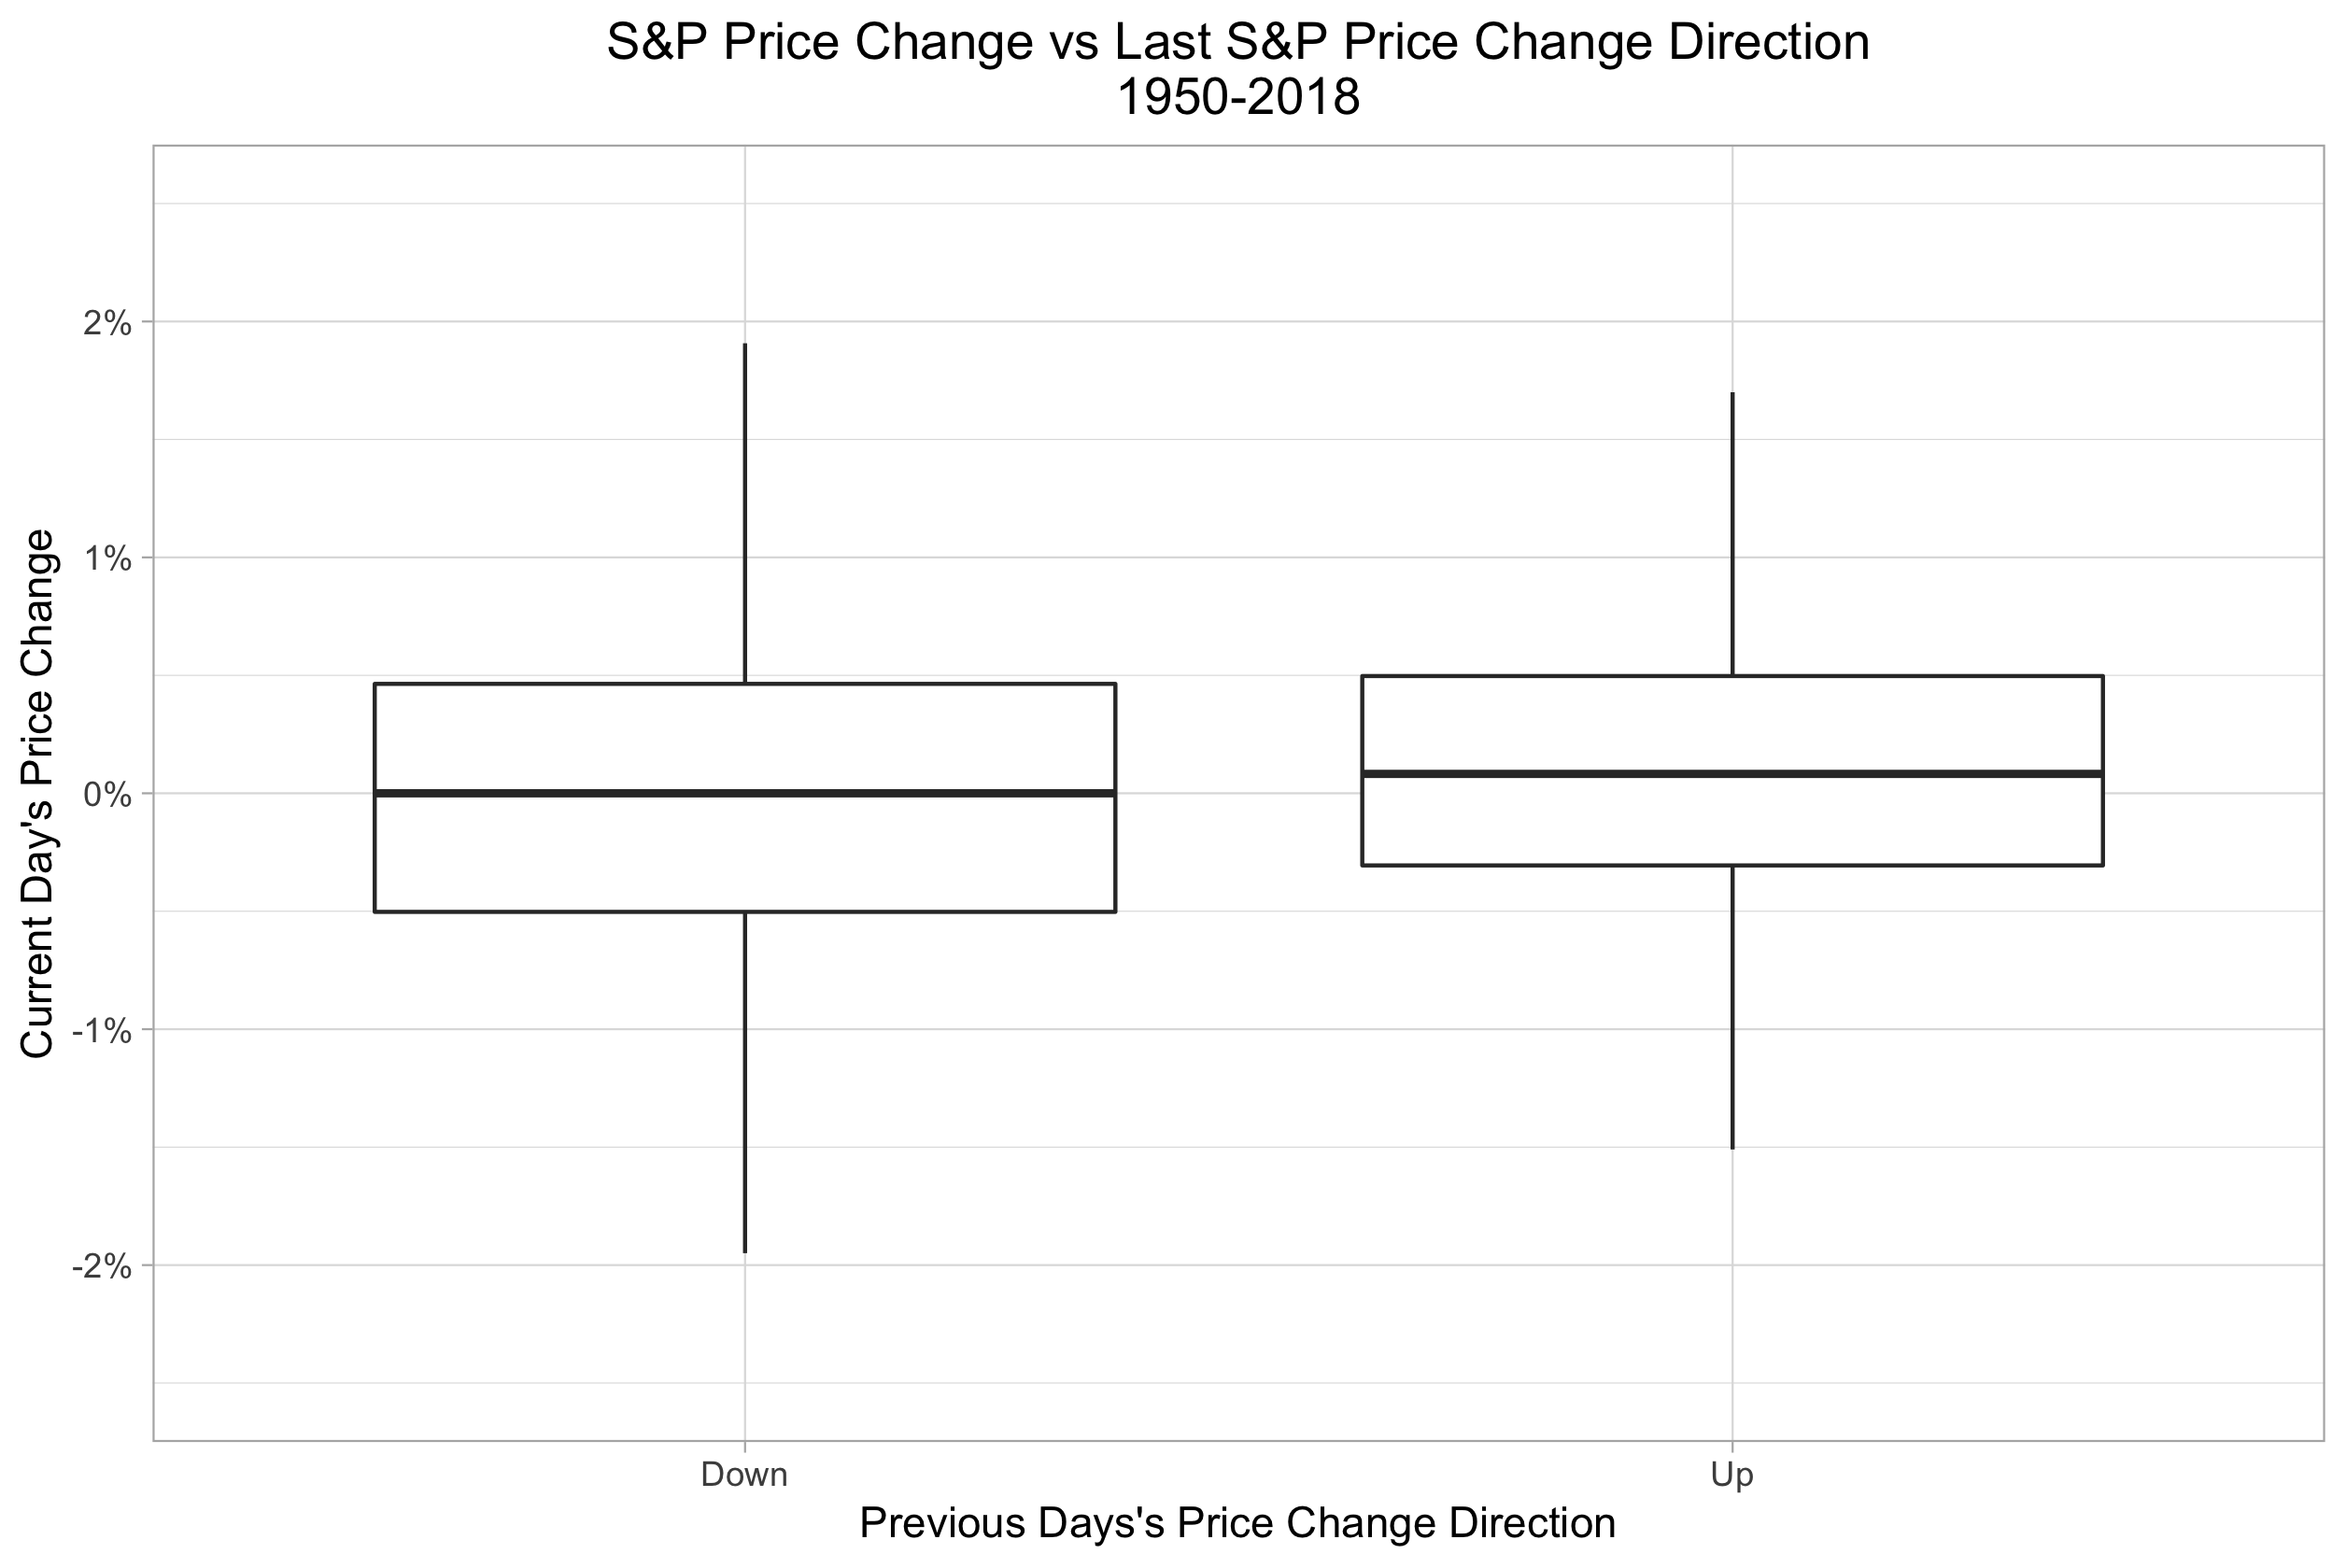 Here's another view of the same data, showing the frequency distribution of each day's change instead of the boxplot's quartiles:
 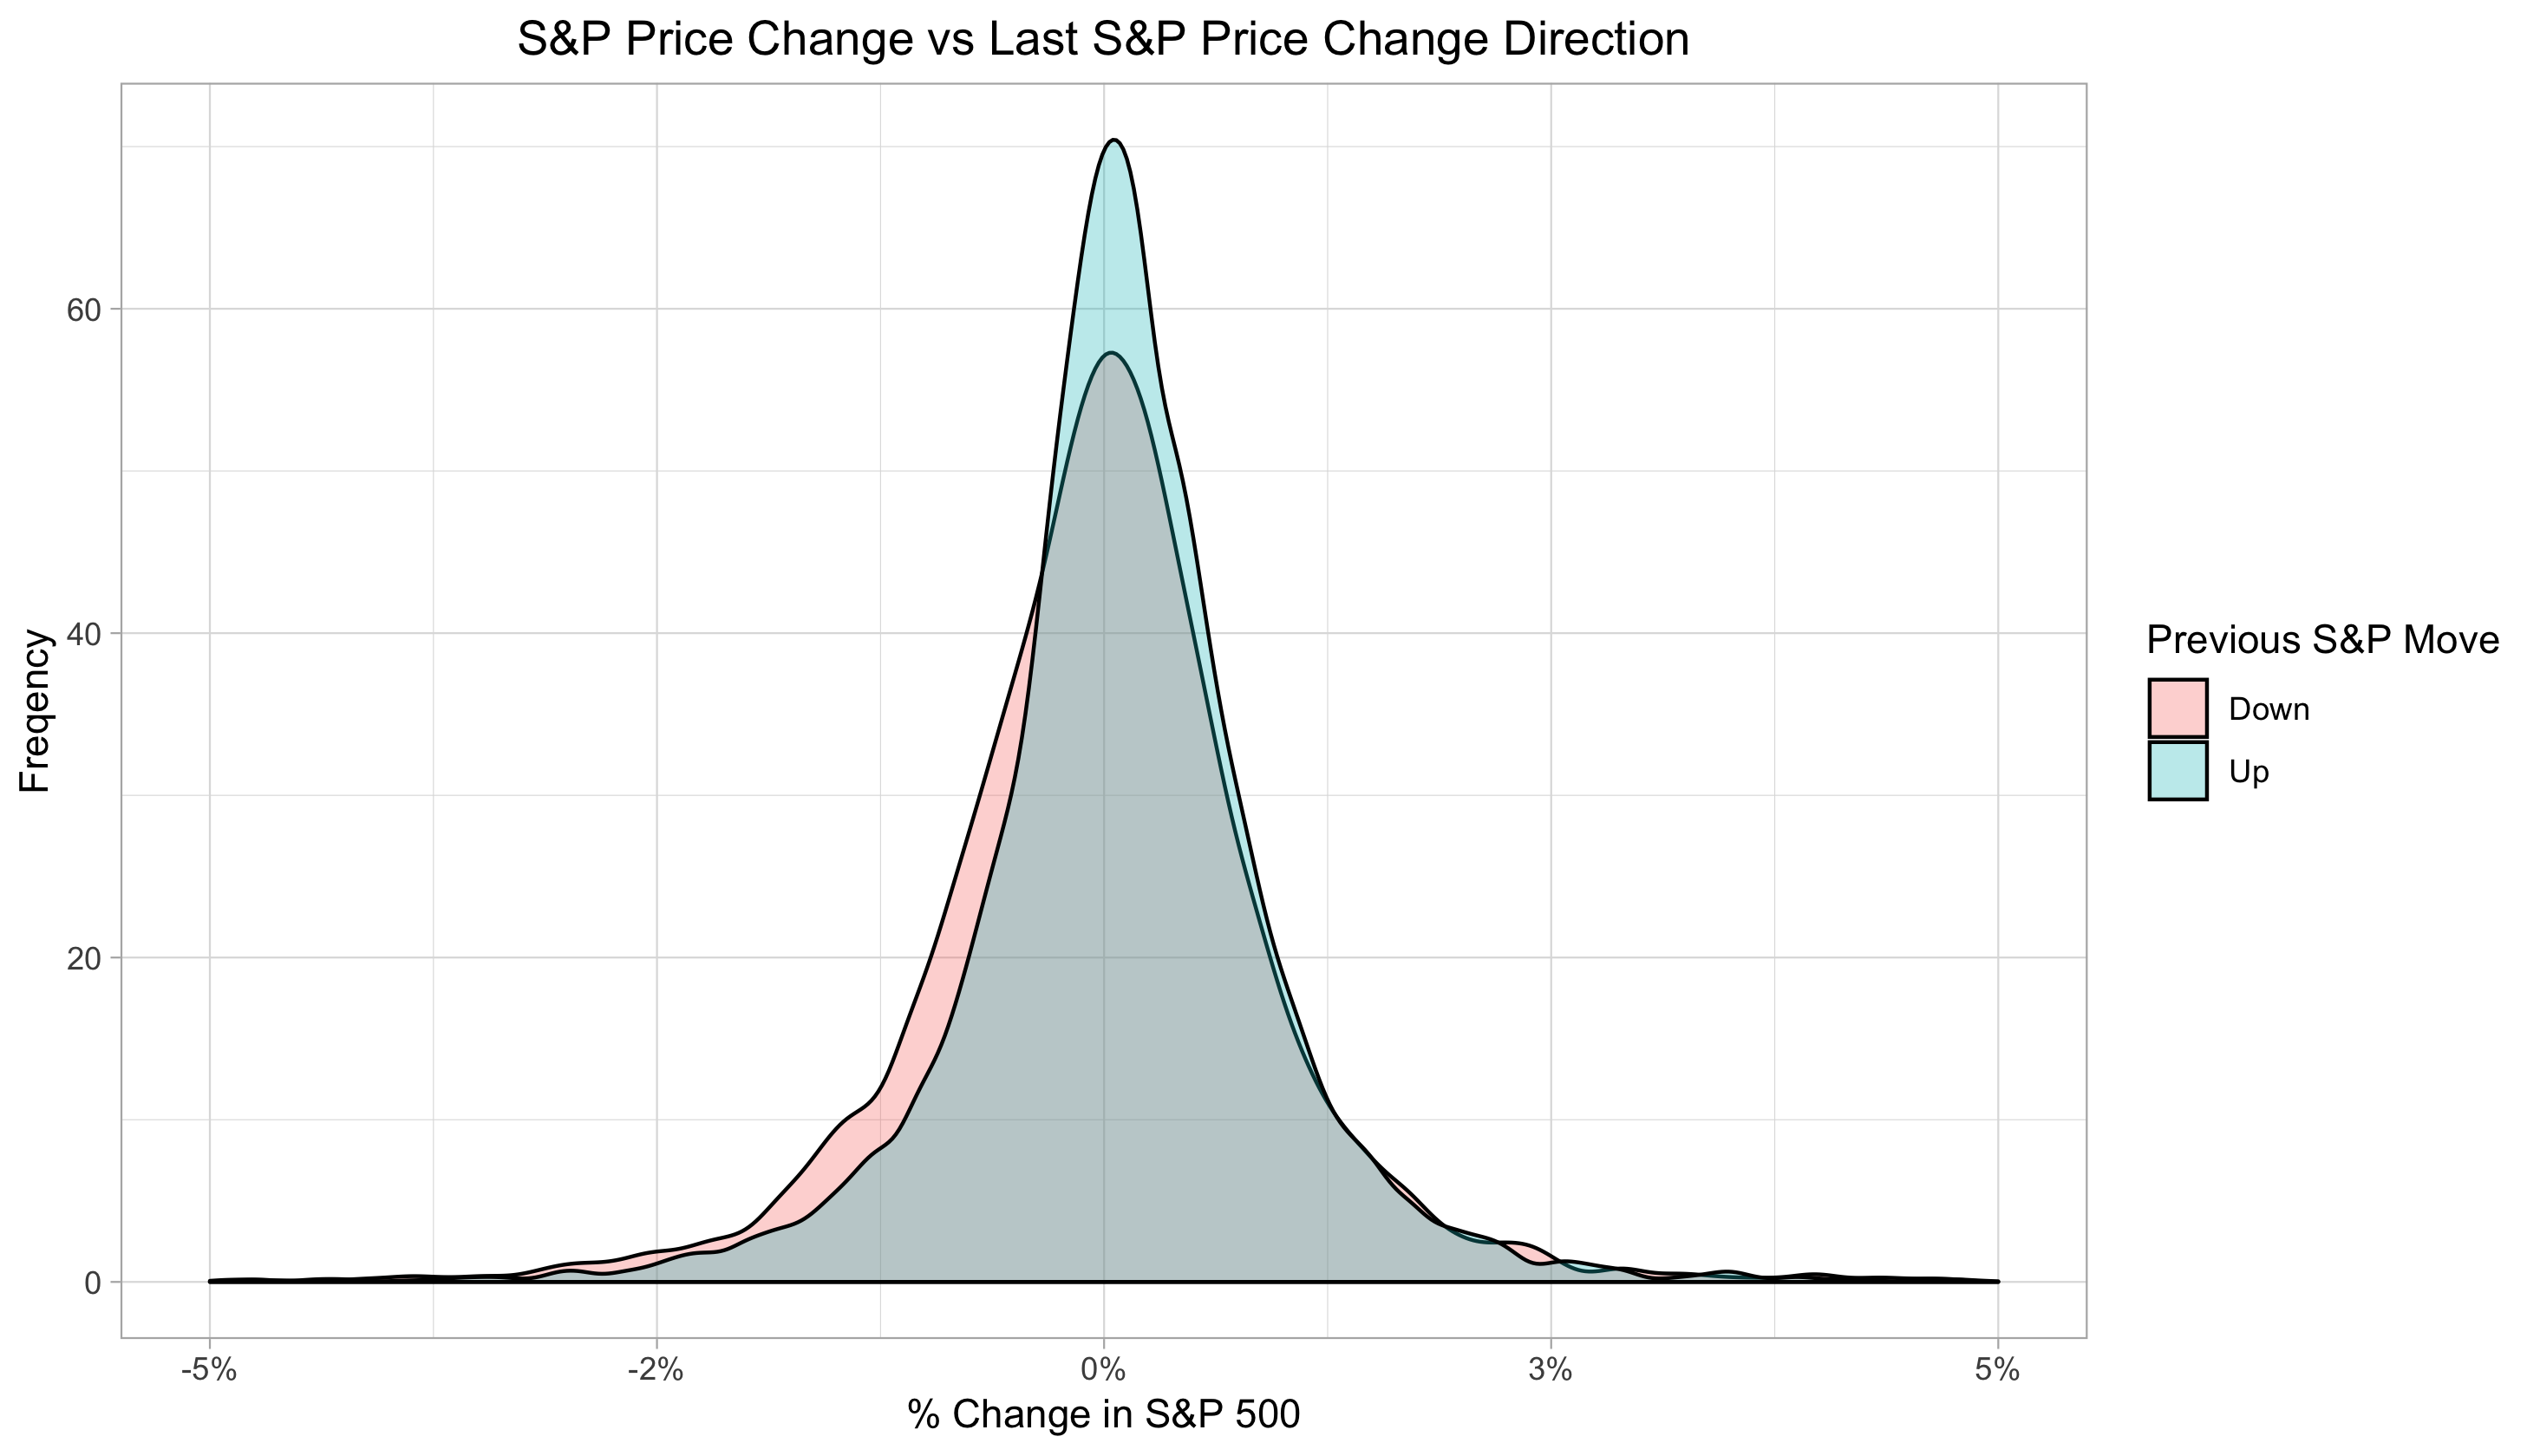 It certainly looks as if stocks do a bit better when prices increased on the previous day, although not by very much. Is this a real phenomenon or just a coincidence? A statistical test can shed some light; here I'll use a chi-squared test of independence to measure whether the current day's price move direction (Up or Down) is independent of the previous day's price move direction. A nice feature of this test is that we don't have to assume anything about the actual distribution of price moves, since we only care if they are up or down. The p-value for this test is 1.082e-14, meaning that if subsequent days' price moves were in truth totally uncorrelated, we would only see correlation this extreme about 1 in 1014 trials. There's no such thing as statistical "proof", but this is pretty strong evidence that the effect is real. However, if the autocorrelation of daily stock price moves is really a fundamental fact of life, we would also expect to see this phenomenon occur consistently across time. Here's where things get weird. Below is a table of the Correlation of adjacent days' price change directions within each year since 1950.
Year
Correlation
1950
0.035
1951
0.143
1952
0.176
1953
0.174
1954
0.210
1955
0.088
1956
0.081
1957
0.174
1958
0.148
1959
0.045
1960
0.190
1961
0.086
1962
0.154
1963
0.068
1964
0.141
1965
0.138
1966
0.263
1967
0.150
1968
0.190
1969
0.250
1970
0.183
1971
0.213
1972
0.231
1973
0.182
1974
0.172
1975
0.131
1976
0.047
1977
0.109
1978
0.170
1979
0.085
1980
0.142
1981
0.113
1982
0.017
1983
-0.068
1984
0.024
1985
0.050
1986
-0.034
1987
0.051
1988
-0.061
1989
0.018
1990
0.008
1991
0.027
1992
-0.036
1993
0.098
1994
-0.051
1995
0.031
1996
0.104
1997
0.020
1998
0.029
1999
-0.001
2000
-0.034
2001
-0.058
2002
-0.093
2003
-0.132
2004
-0.045
2005
-0.136
2006
-0.075
2007
-0.141
2008
-0.151
2009
-0.093
2010
-0.037
2011
0.039
2012
0.101
2013
-0.068
2014
-0.118
2015
-0.067
2016
-0.137
2017
-0.085
2018
0.004
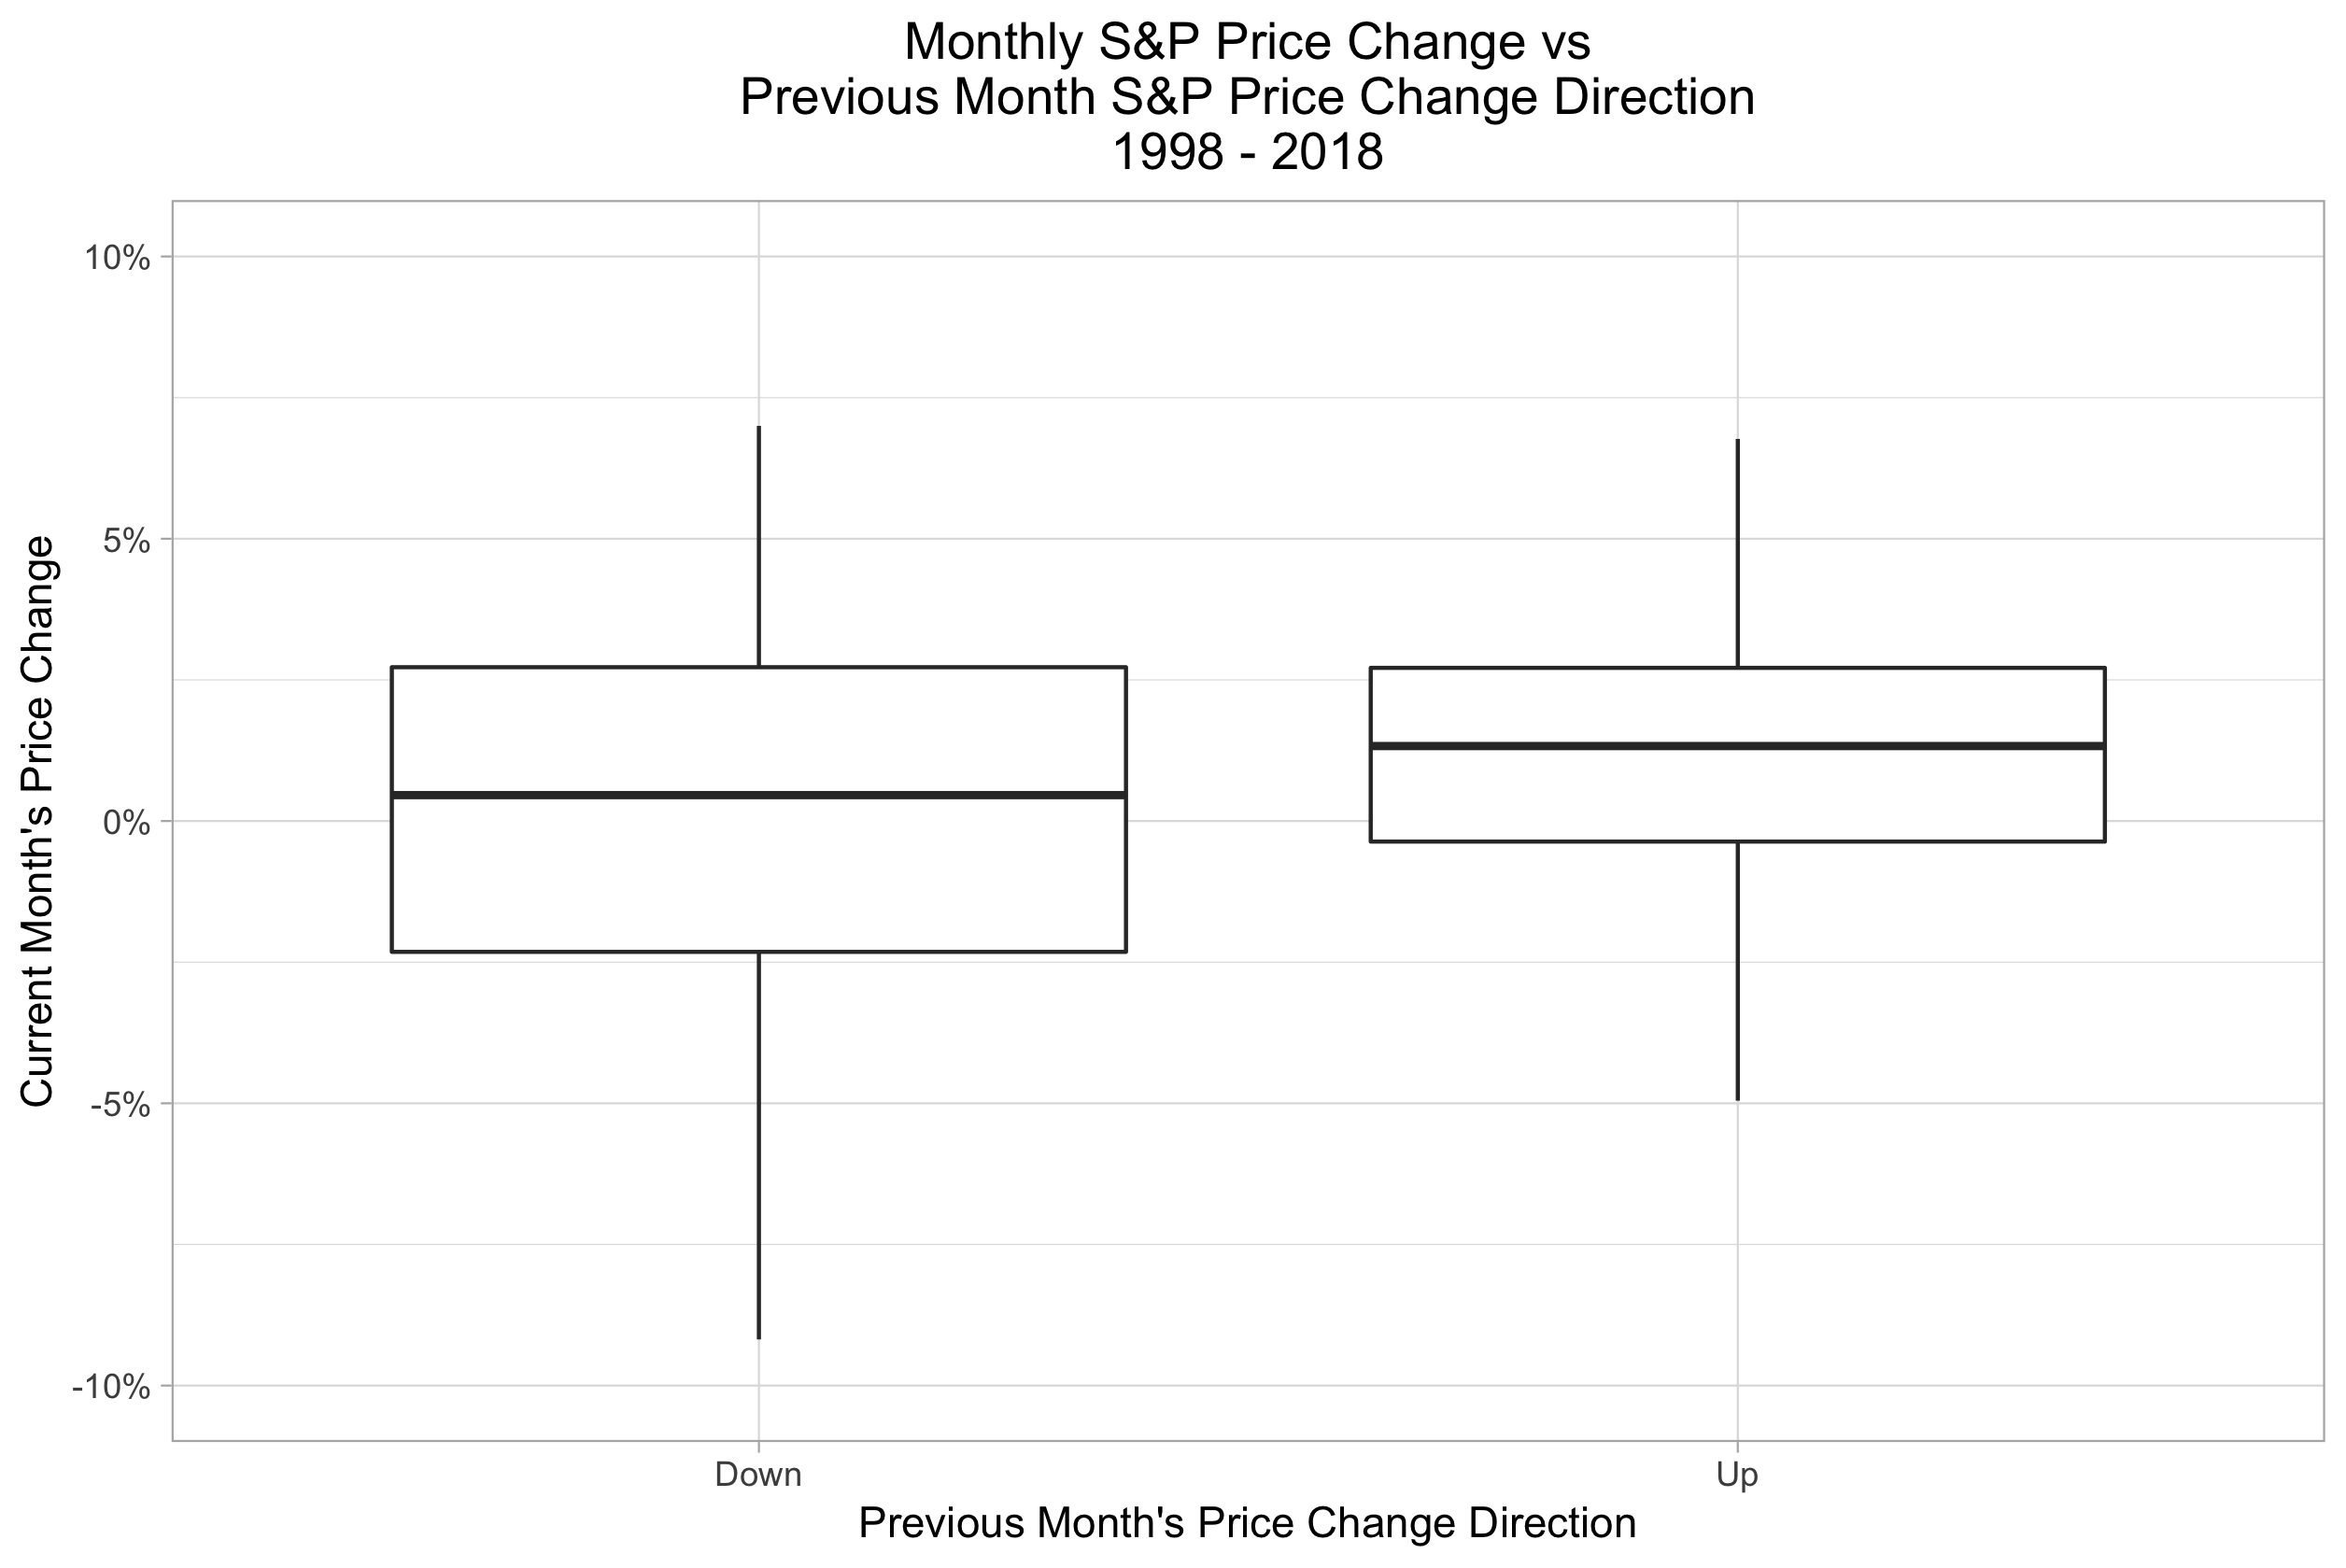
The correlation is positive every year from 1950 - 1982, then there are a few negatively correlated years, and then from 1999 to the present, all but 3 years are negatively correlated. It's not just that the effect has disappeared; rather, in the last 20 years it seems to have reversed! I don't know quite what to make of this. A lot has changed in the stock market since 1950, so perhaps the disappearance of daily S&P 500 price momentum is an effect of new technology or new actors in the market. Like any market phenomenon, this one could be arbitraged away by traders trading on it. However, in that case I would expect to simply no longer see consistent correlation between price movements on subsequent days; in other words to see the trend disappear, but not be reversed. This is, again, weird. Perhaps this reversal isn't due to traders arbitraging away the already very slight day-over-day momentum effect, but is instead a by-product of some other relatively new trading strategy(s) e.g. high-frequency trading. Fortunately, if you plan on using a momentum-based strategy to time entries into and exits from the market, the trend seems to hold up for longer time frames. Here's a similar look at the data on a monthly basis (monthly S&P price data from Prof. Robert Schiller) for the last 20 years:  On a month-over-month basis, S&P price momentum is alive and well. In fact, it's still pretty strong: during this period, a month of falling stock prices is followed by an average price change of -0.30%, versus an average price change of 0.94% after a month of rising stock prices. For comparison, here's the same chart for 1950 - 1998, and, since the Schiller data goes back to 1870, 1870 - 1949 as well:
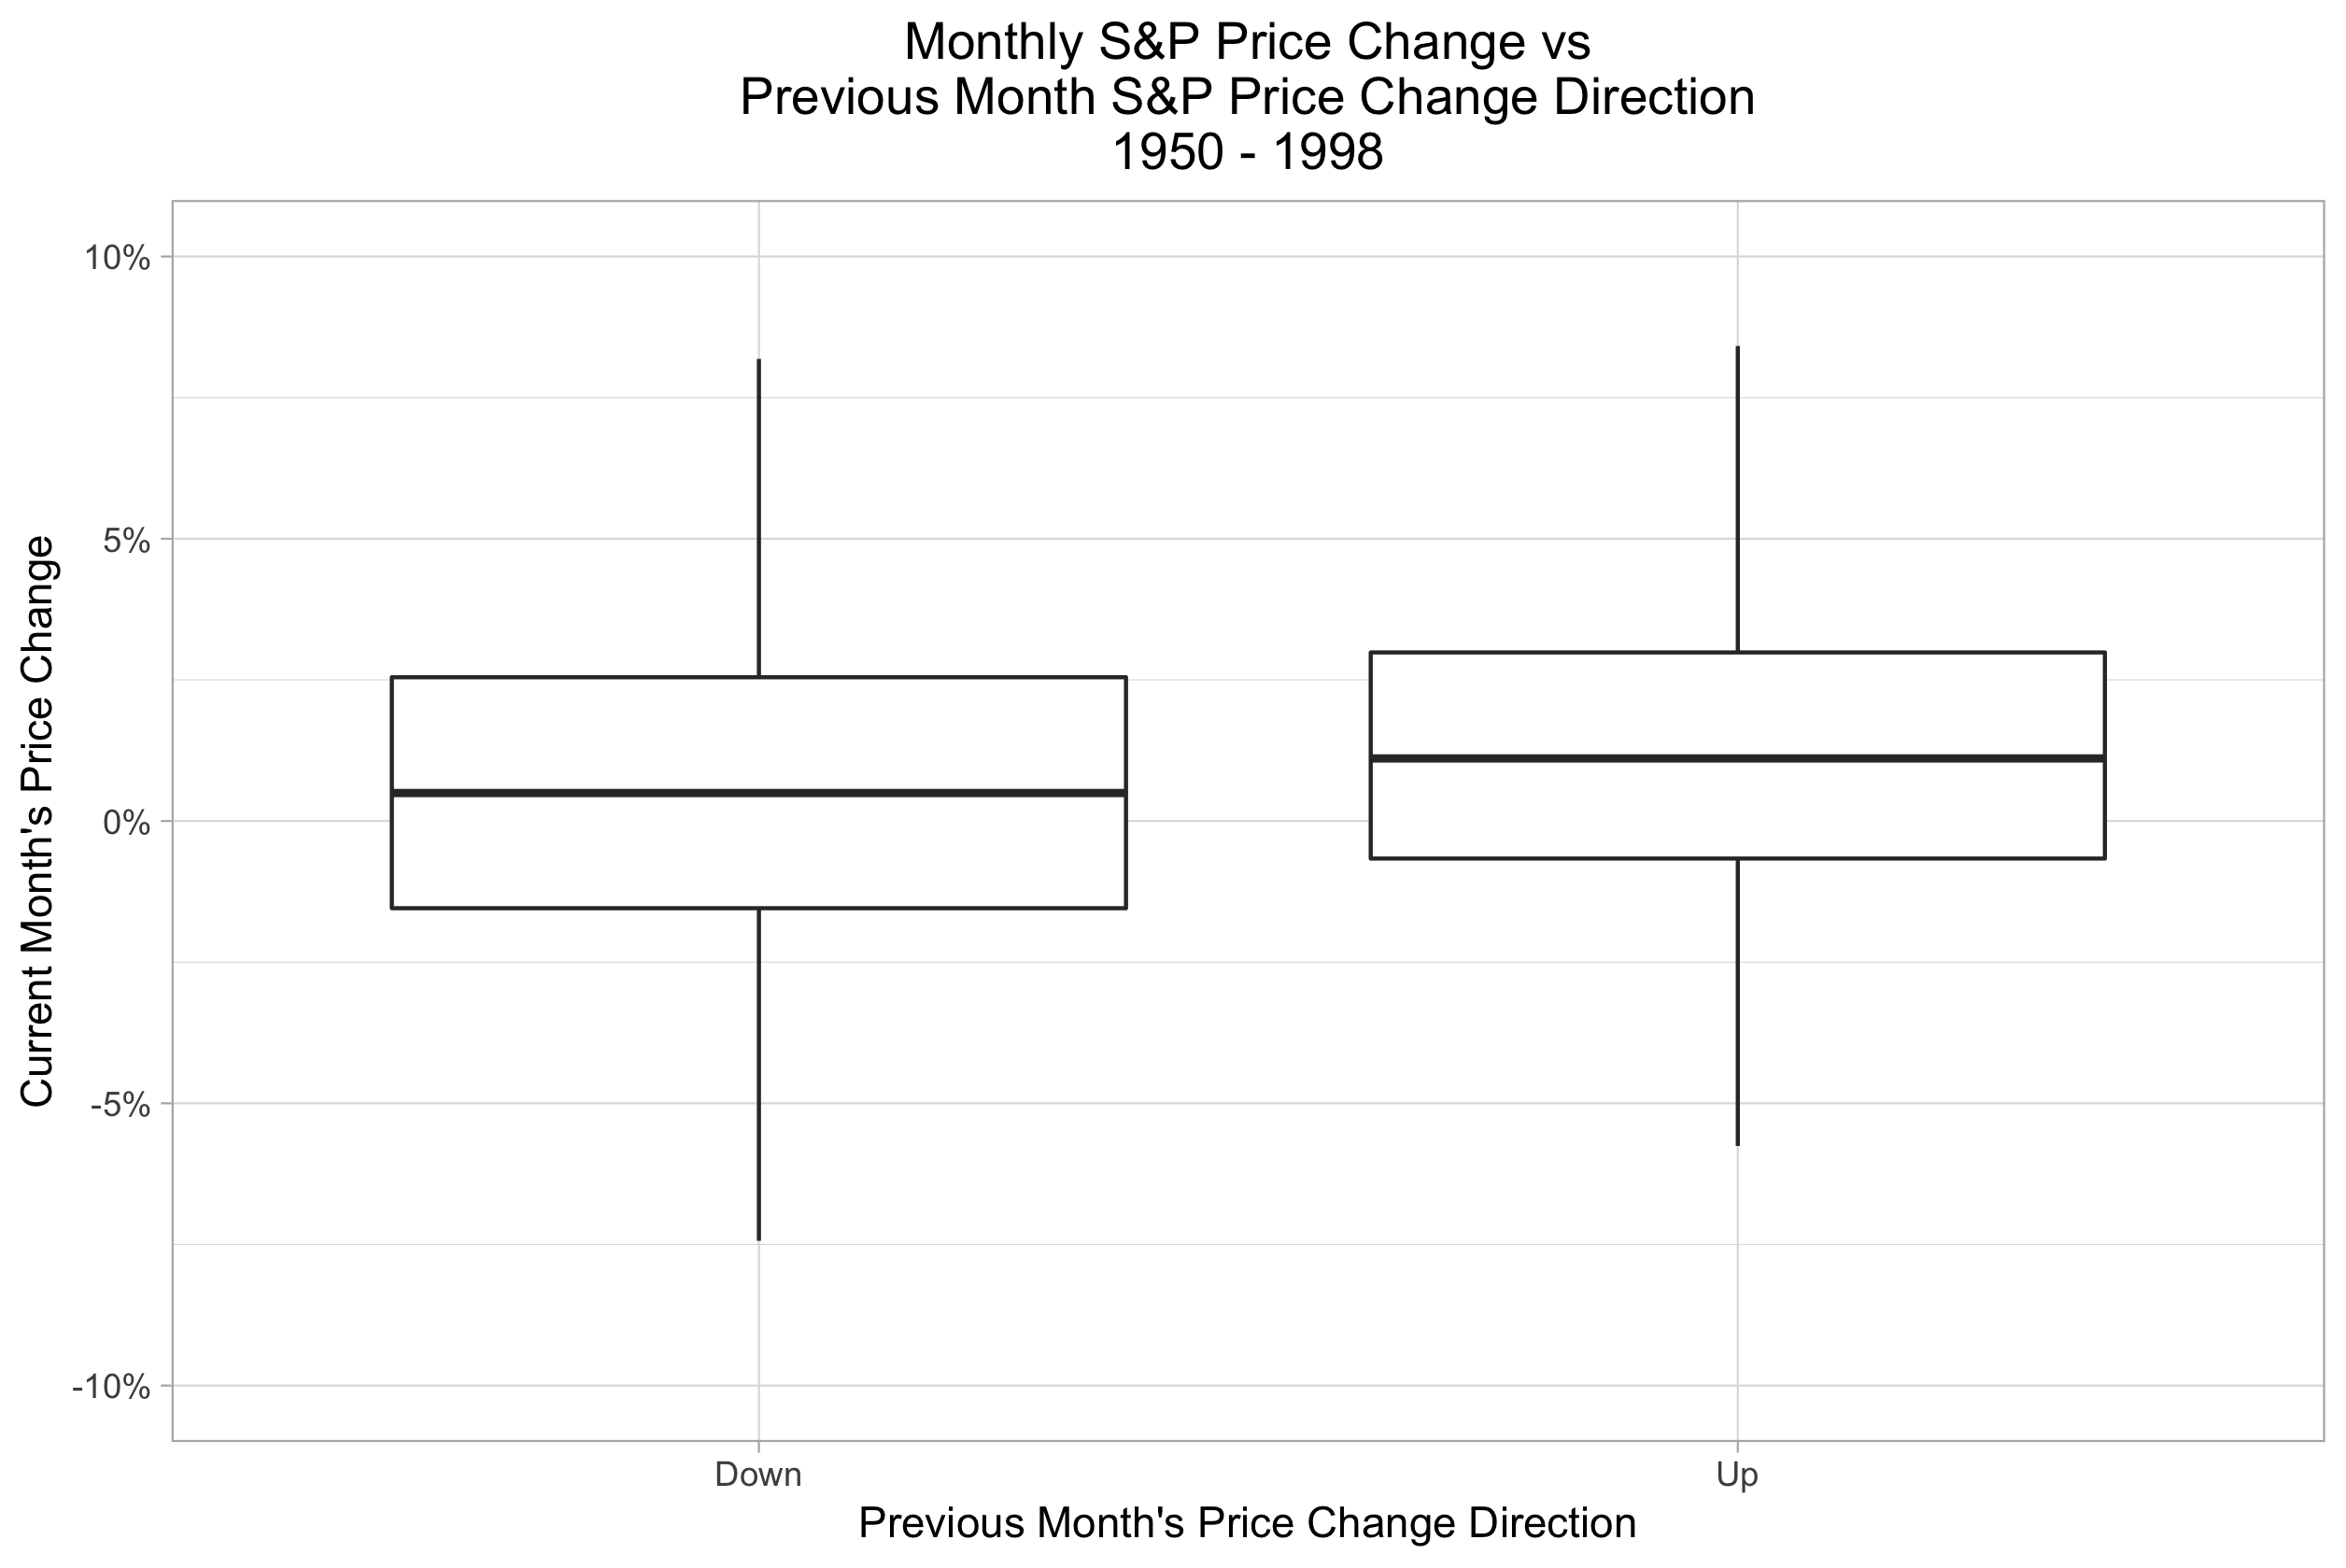
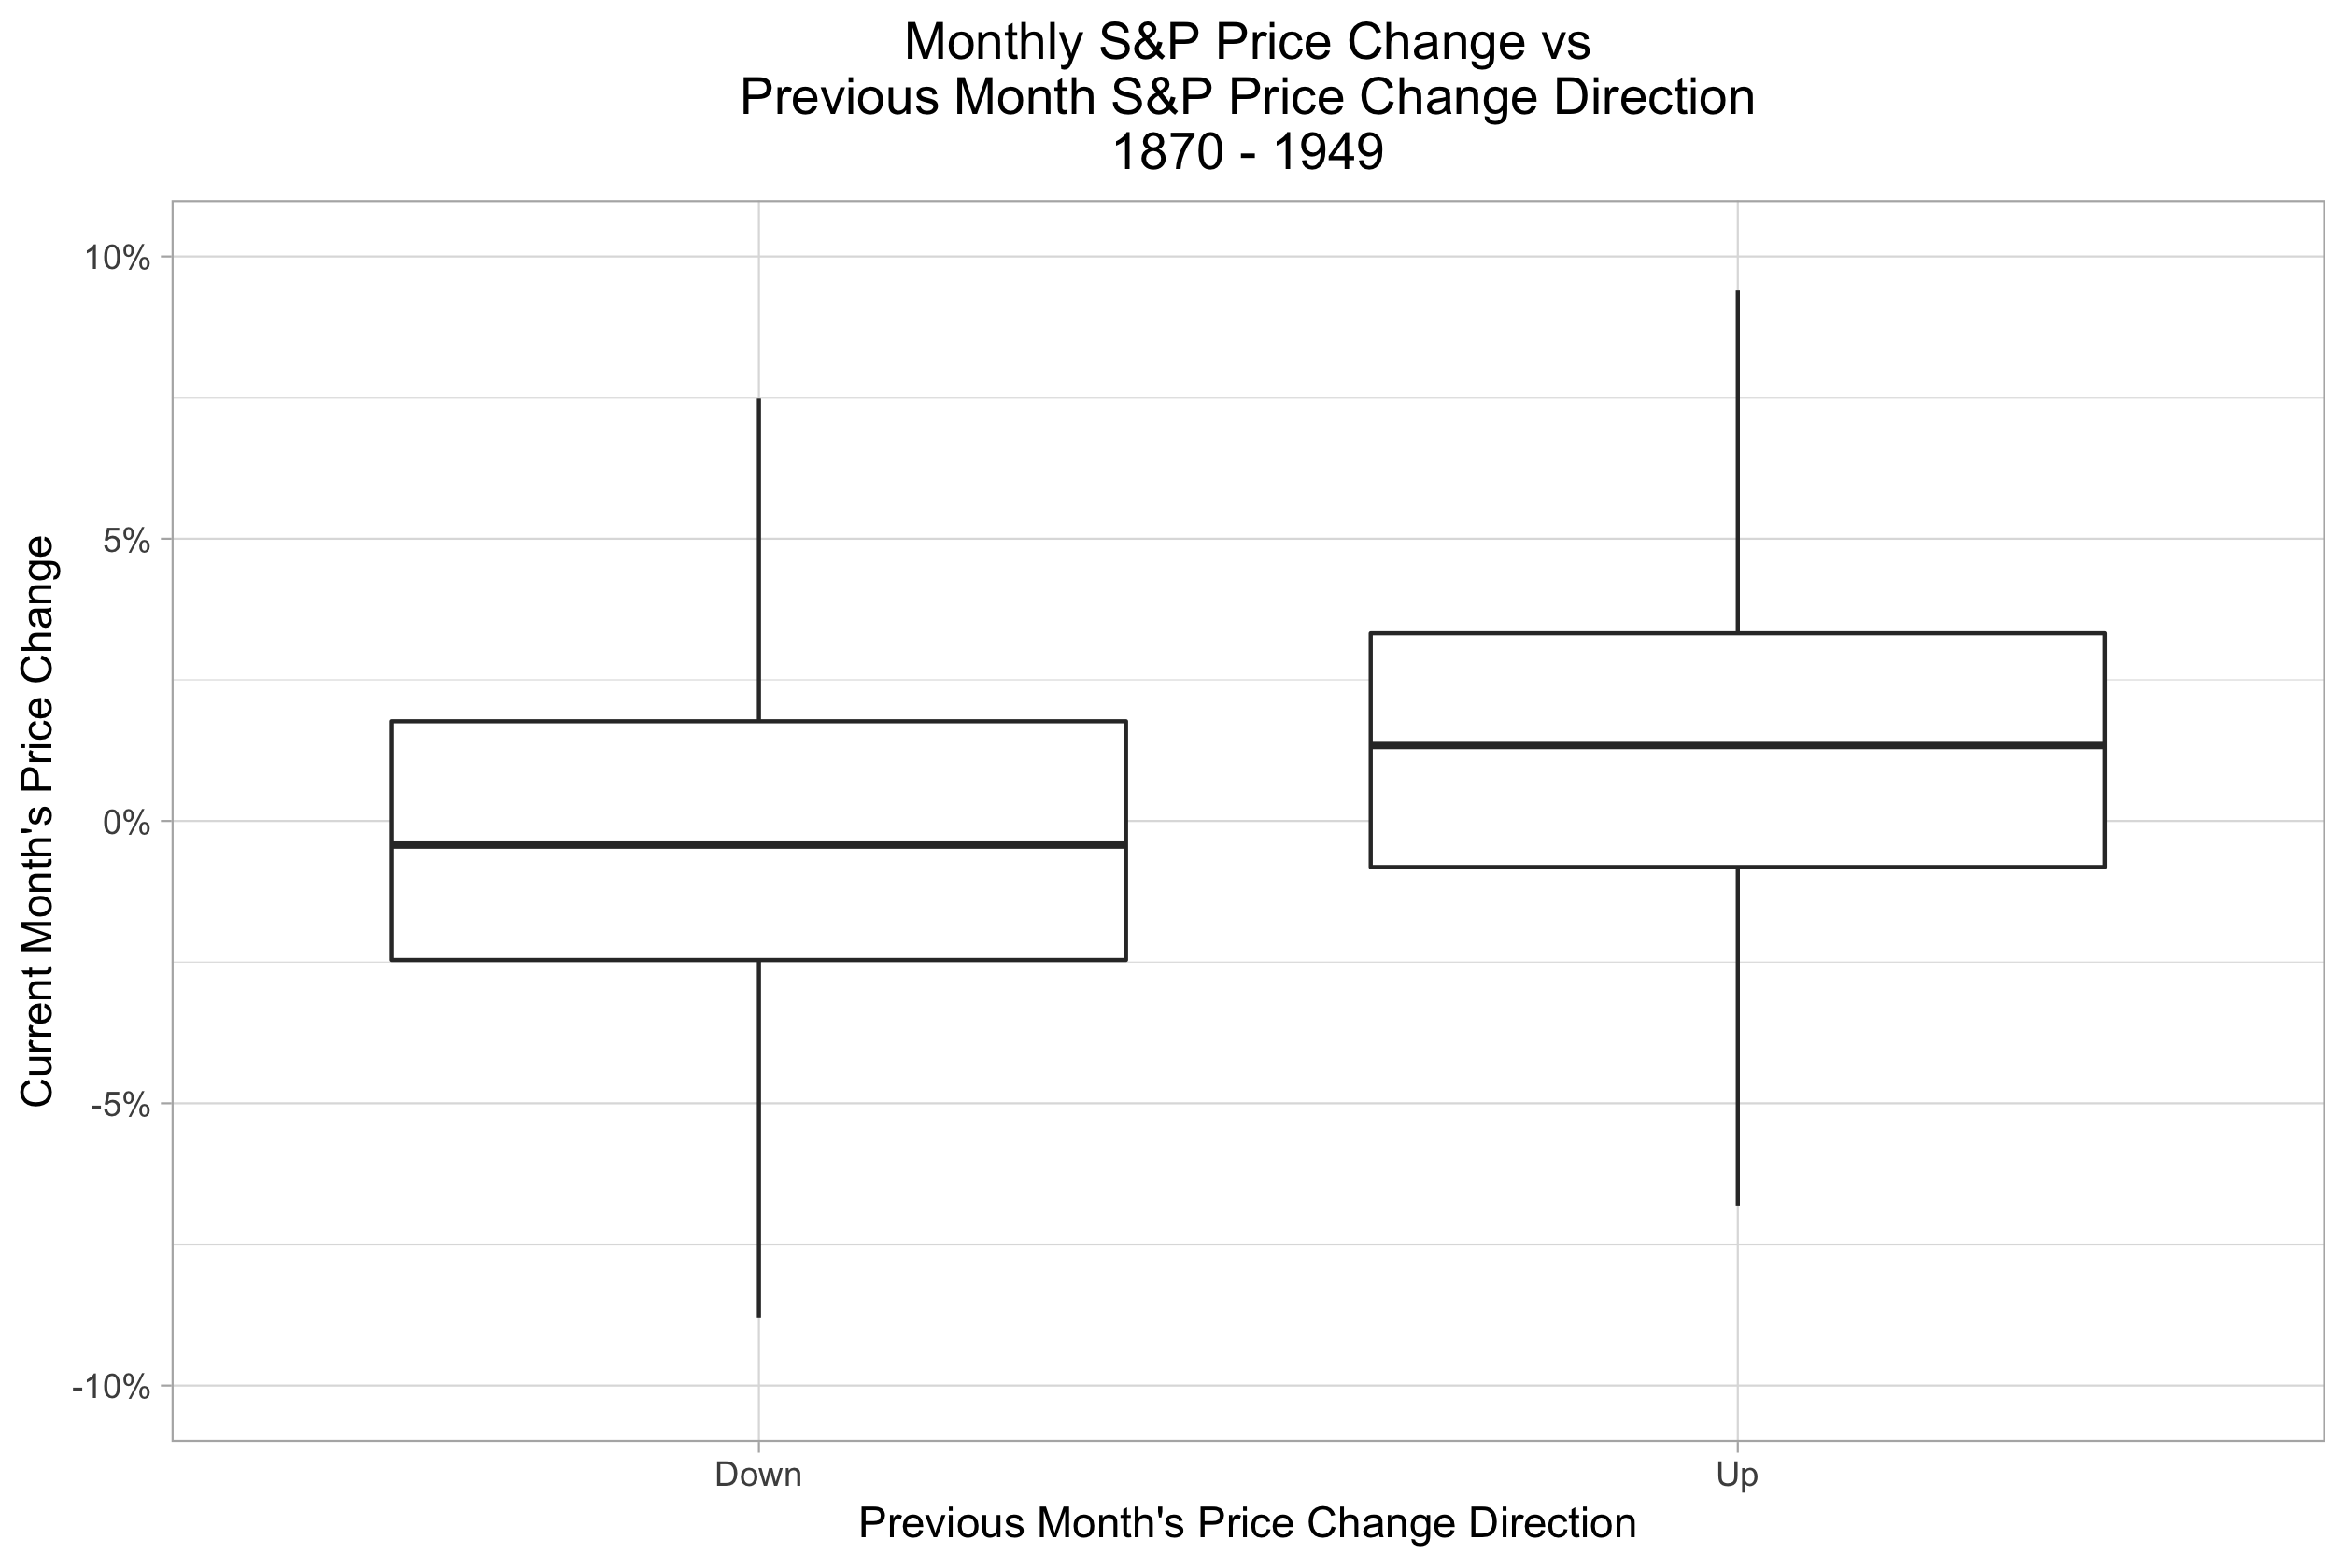 In each period, the price change for a given month is likely to be higher if prices also rose in the previous month. A chi-squared test of independence for the price change directions in each period shows statistically significant p-values for each as well: 2.323e-11, 0.02282, and 0.01508 for 1870 - 1949, 1950 - 1998, and 1998 - 2018 respectively. So it seems that whatever broke the trend for day-over-day S&P 500 price momentum hasn't done so for the month-over-month version. Finally, here's a look from one more angle: S&P 500 price changes for the current 6-month period, bucketed by the direction of the price change for the last 6 month period. Here I'm again using the Schiller data, and looking at each month as a separate data point, on a rolling basis. Since the data points are correlated (each monthly data point has a 5-month overlap period with the previous month's price change data), I can't run a statistical test to measure the strength of the effect here; I'm just looking at the direction of the effect.
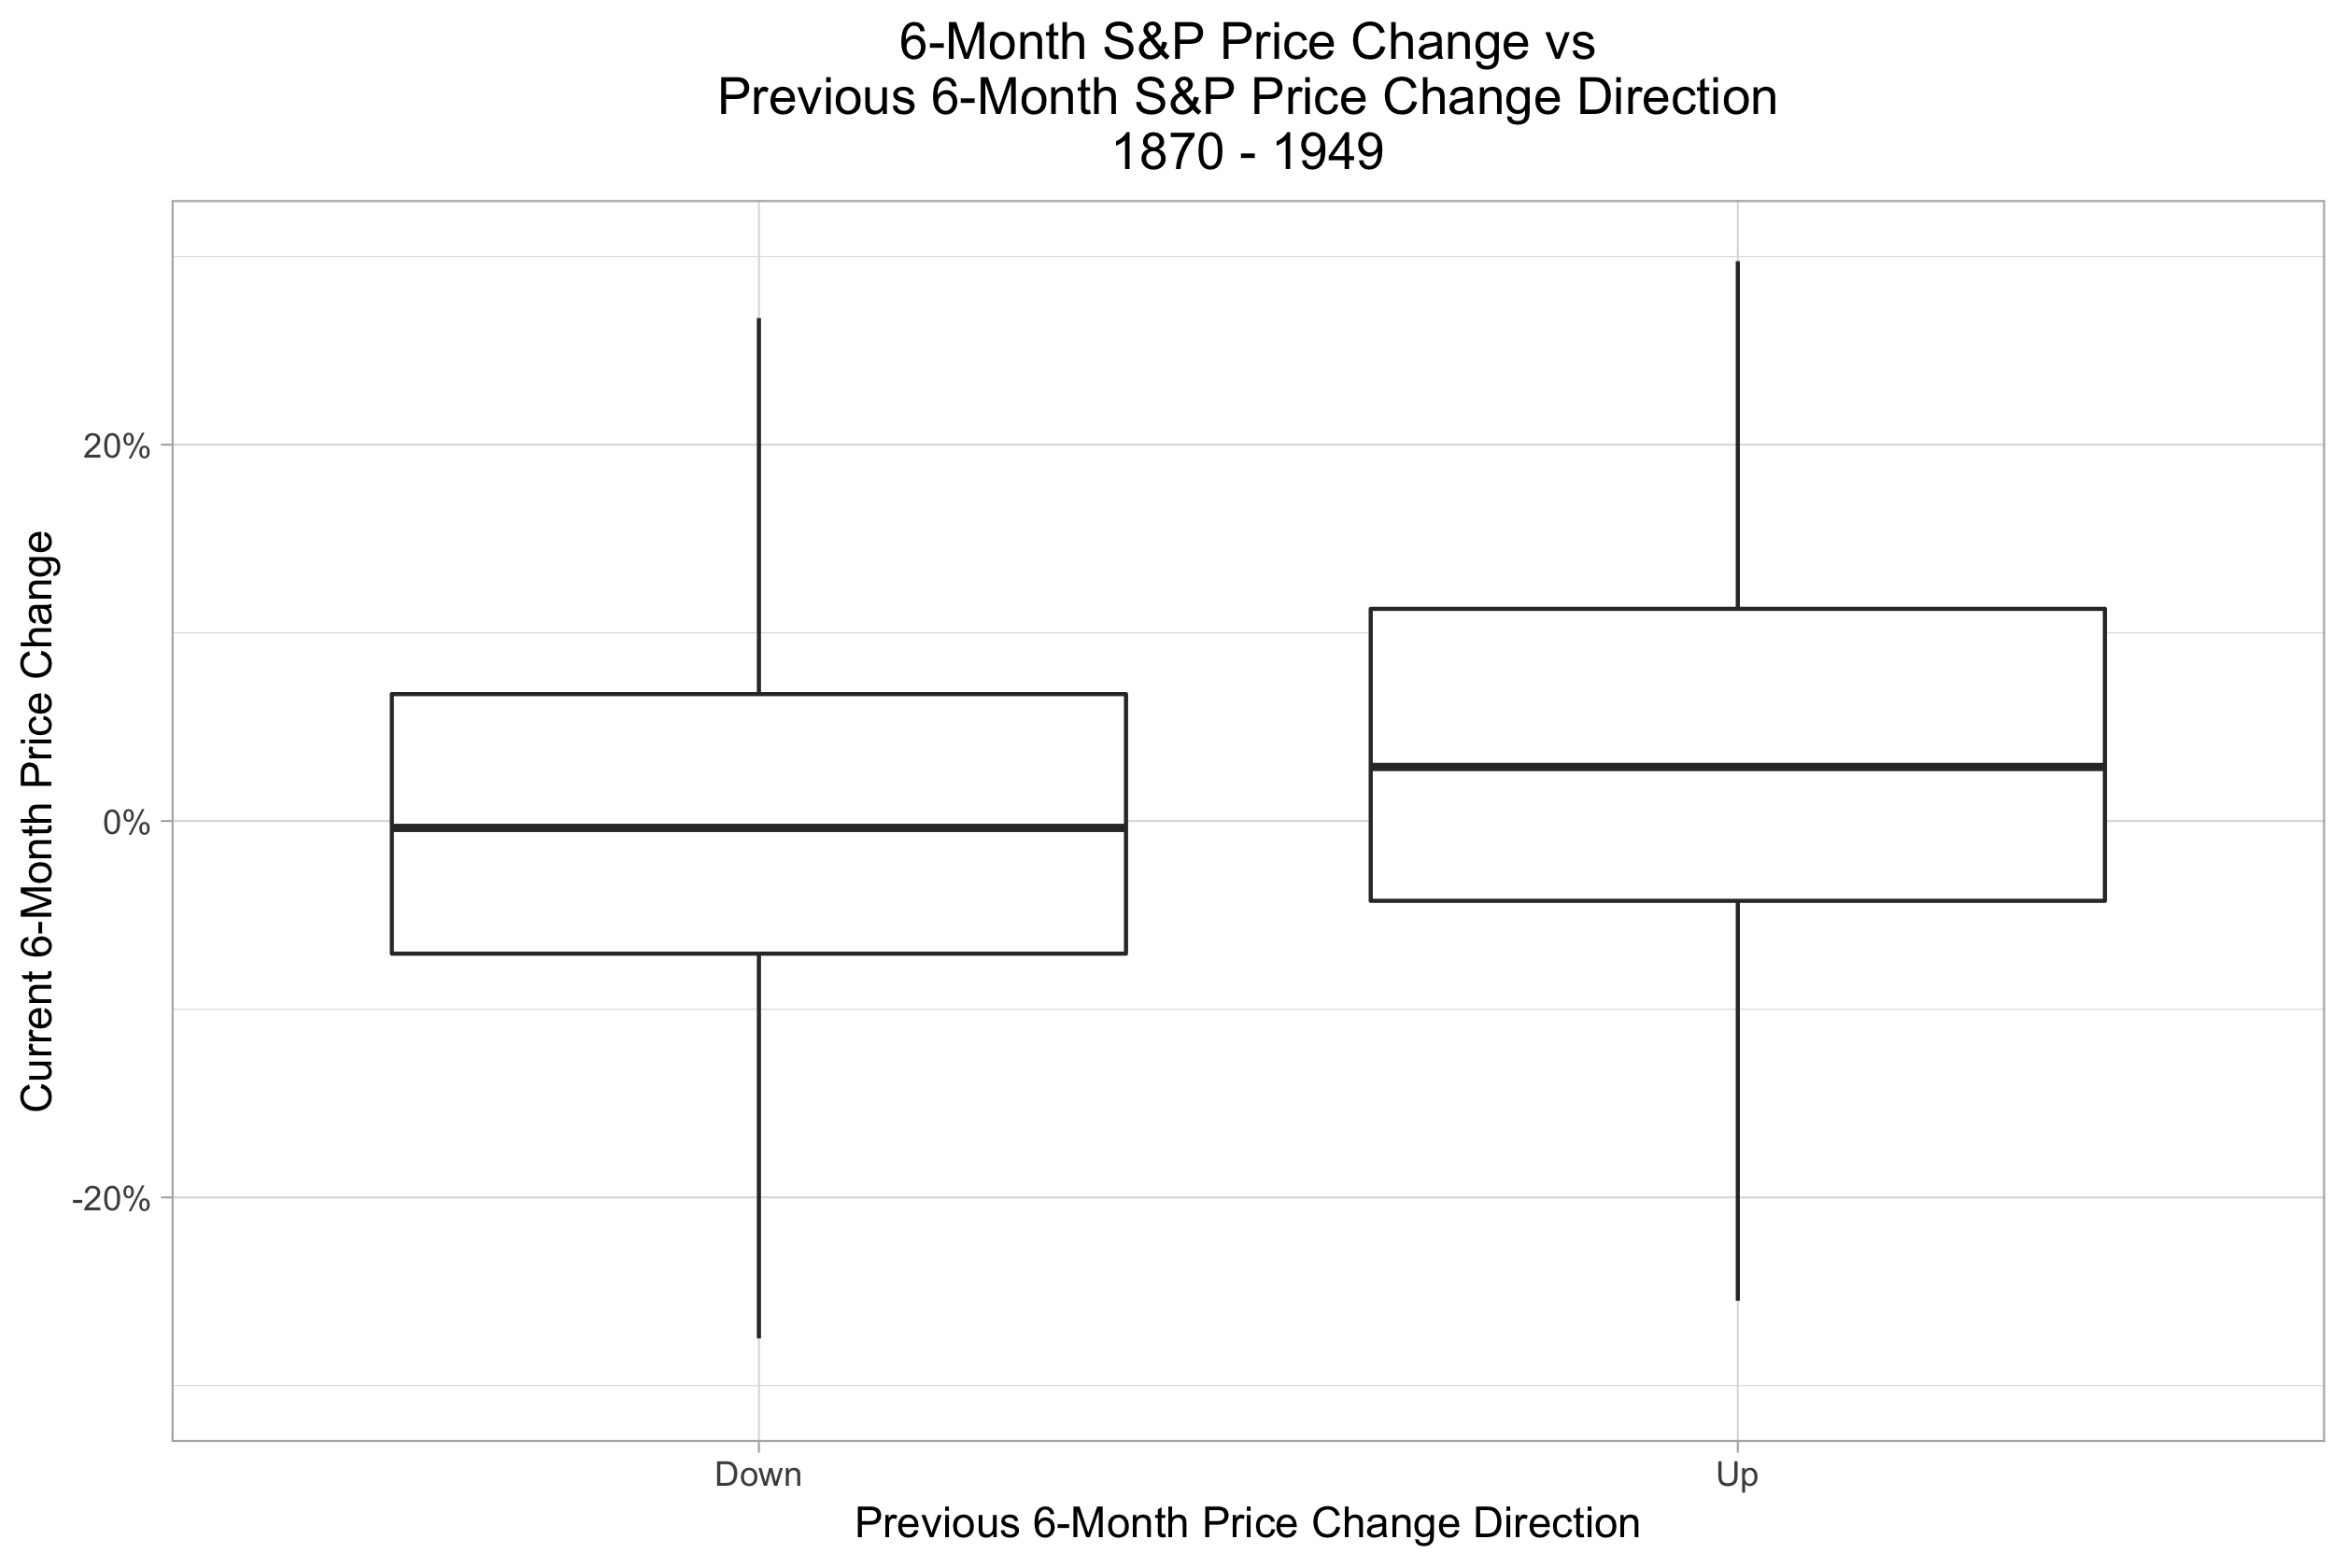
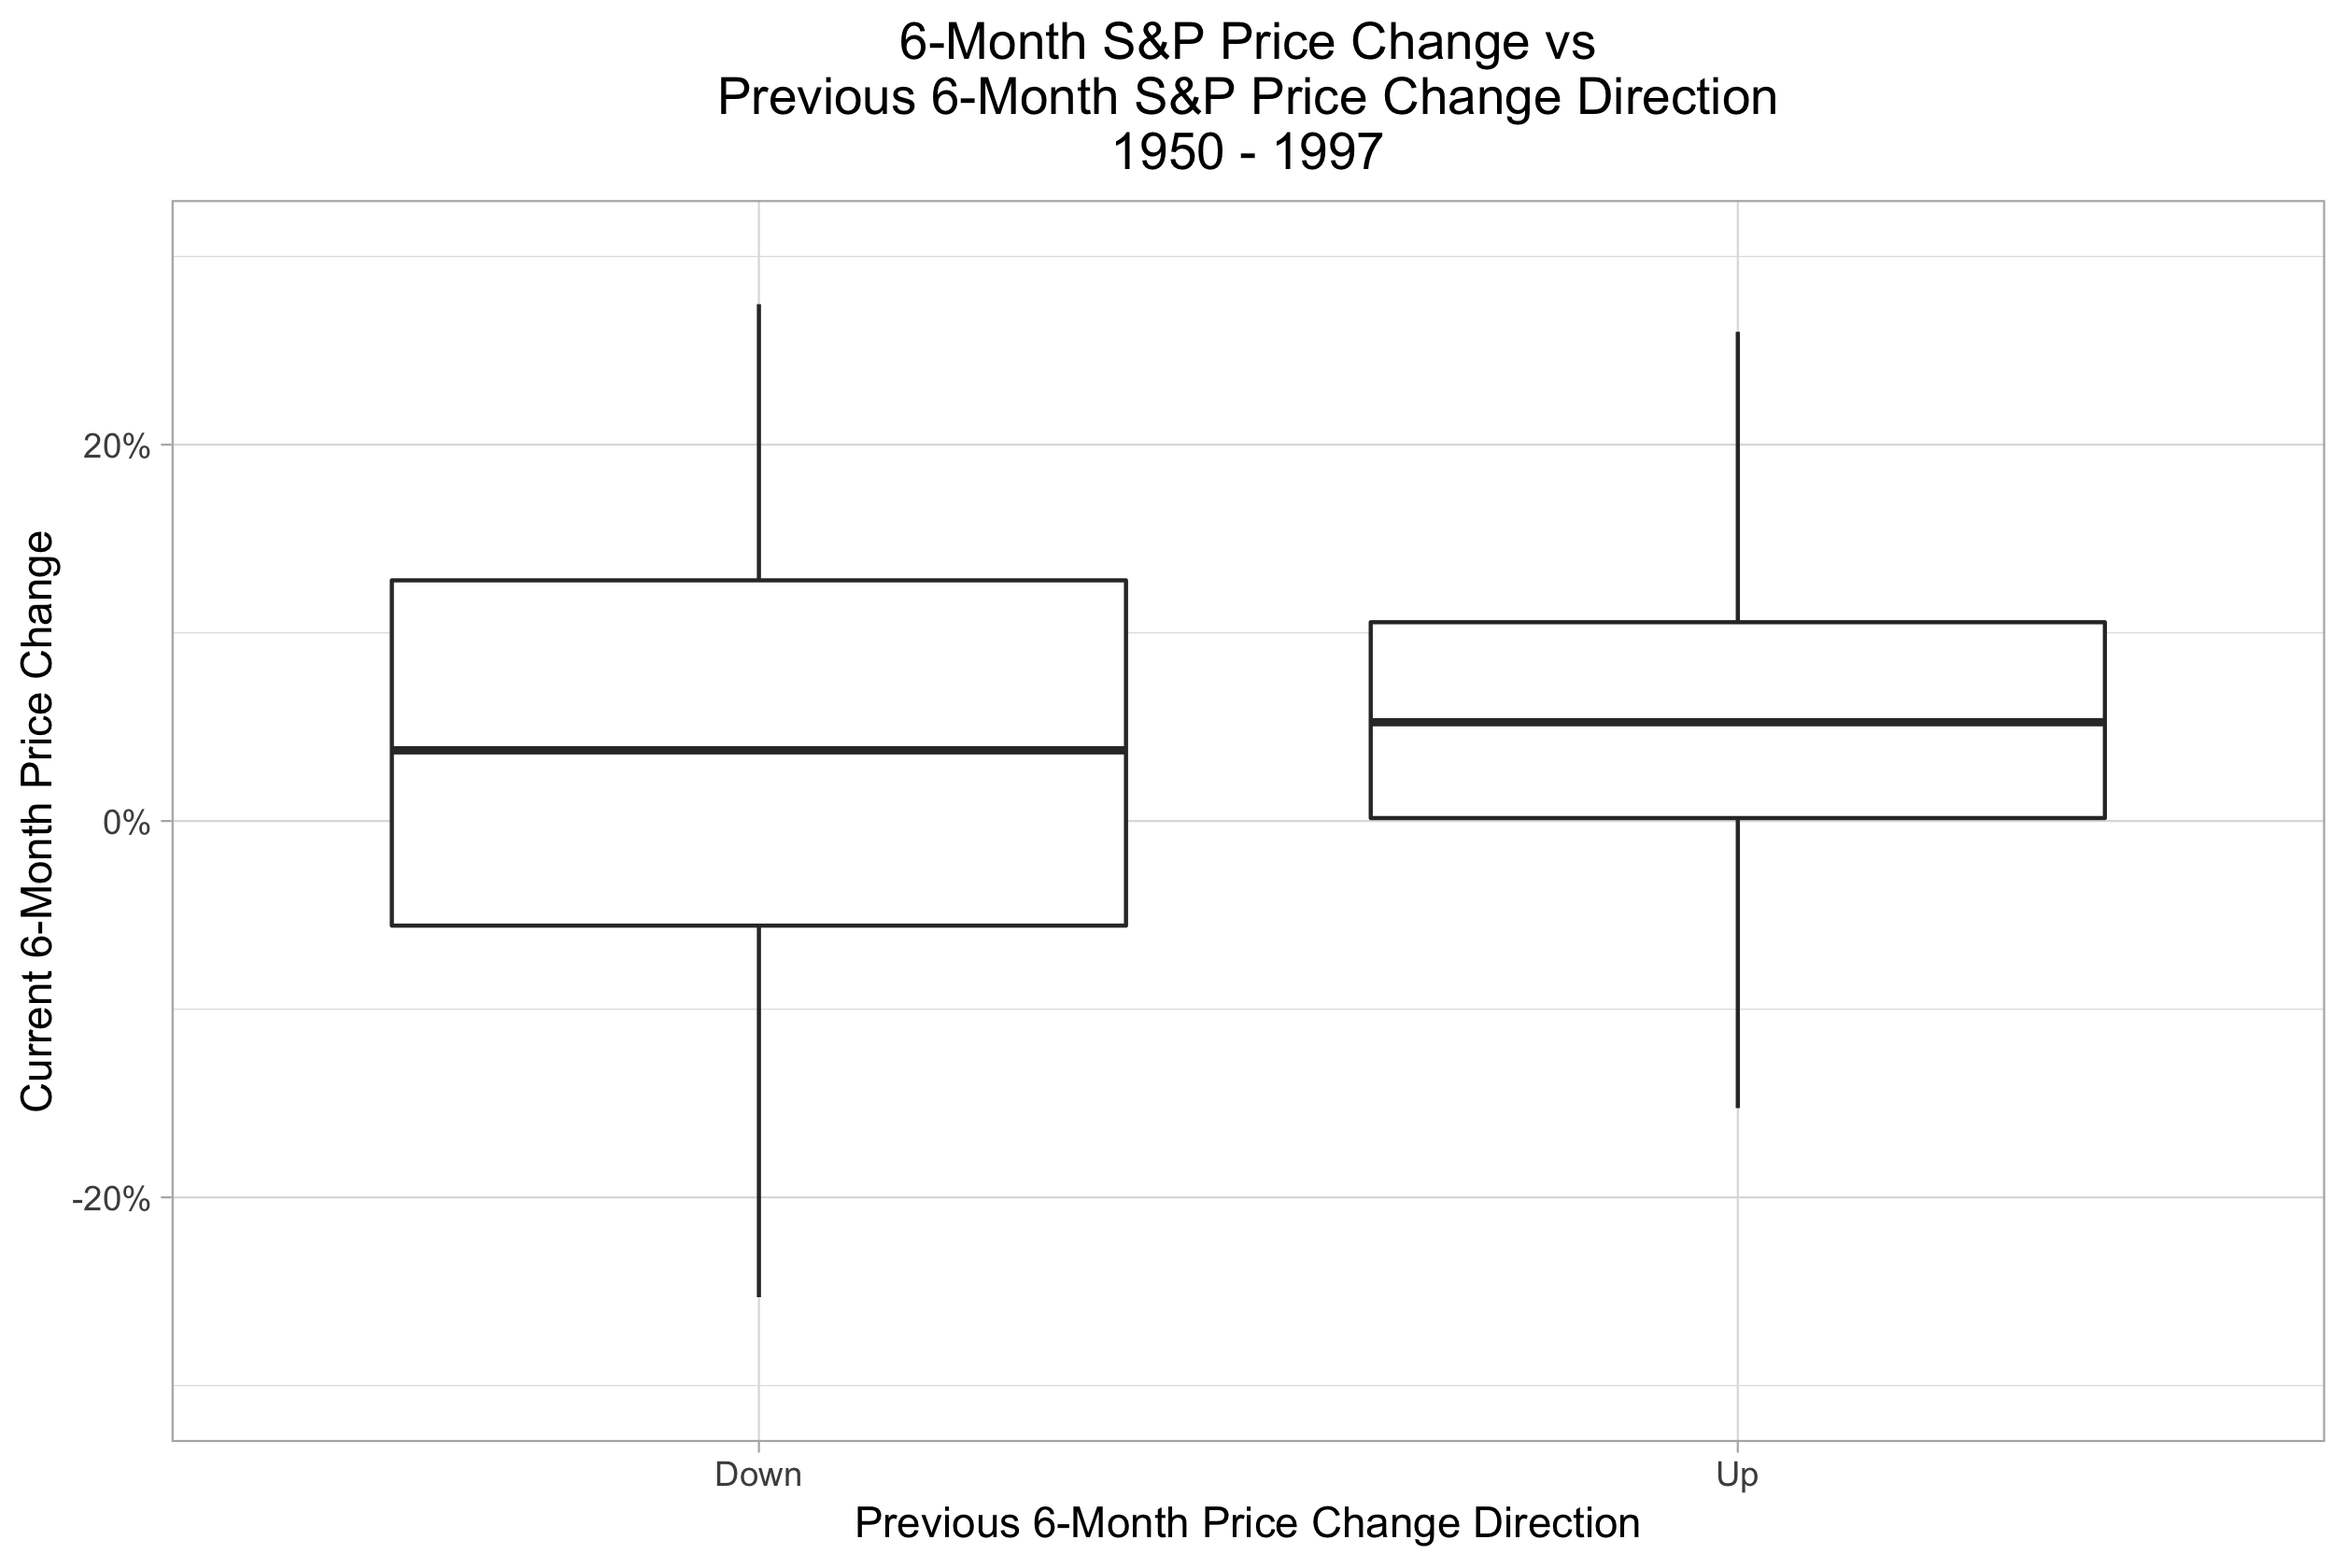
 Again, in each case we see that price movements in the current 6-month period are positively correlated at least to some degree with price movements in the previous 6-month period. Momentum seems to have held up on a semi-annual basis as well. So what have we actually learned? Across the board, the evidence is strong enough that I believe stock price momentum does in fact exist. However, the reversal of the effect for the daily price data since 1999 means that it's not some iron law of the universe. I had no intention of using a momentum-based strategy for trading on a daily time frame anyway, so the disappearance of the effect on a day-over-day basis doesn't matter for my purposes in and of itself. However, I have entertained the idea of using longer-term momentum as part of a trading strategy, and the daily momentum effect reversal serves as a caution sign on that road. It means there is no guarantee that momentum will continue to be a thing in the future for other time frames; if daily momentum can disappear for 20 years, monthly, 6-month, or any other flavor of momentum for the S&P 500 (or other indexes or securities) could do so as well.